
Field Notes
<--2015-11-03 09:00:00 | 2015-12-02 09:30:00-->Other sites visited today: East End | Tonzi | Tonzi
Phenocam link: Searching...
Vaira: 2015-11-20 10:00:00 (DOY 324)
Author: Joe Verfaillie
Others: Siyan
Summary: Added fence posts, dug up Peltier SHF plates - two removed, RPi would not reboot - card brought in.
| Vaira 2015-11-20 I arrived about 10:00 with Siyan. It was mild, clear and sunny with a little bit of haze. The grass doesn’t seem much different from last time. The puddles in the road have nearly completely dried up and the ground surface looks dry. I don’t think there was much rain here from the last storm. The biomass cage has been moved since last time. I added five new fence posts and reset one of the old fence posts to the cow fence at Vaira’s request. The fence does look better, but it could use a couple more longer insulated standoffs for the electric wire. I dug up the Peltier soil heat flux plates. One sn P03 had been chewed by a gopher and the other sn P04 had a broken wire where the wire had corroded at a small break in its insulation. I removed these two sensors and might be able to repair them in the lab. Next time out we need to check the depths and reset the thermocouples. Siyan collected data, did soil moisture and spectral measurements. The Raspberry Pi was being slow and would not restart. It seems like there is a bad spot on the memory card. We brought the memory card in. There will be no phenocam images recorded until we replace the card. |
Field Data
No tank data
Well Depth
| Date | Location | Depth (feet) |
|---|---|---|
| 2015-11-20 | TZ_floor | 31.9 |
| 2015-11-20 | TZ_road | 38.8 |
| 2015-11-20 | TZ_tower | 36.5 |
mode = both
Moisture Point Probes TZ
Array
(
[0] => Tower_1
[1] => Floor_South_1
[2] => Floor_East_1
[3] => Floor_West_1
[4] => Soil_Transect_3_1
[5] => Soil_Transect_2_1
[6] => Soil_Transect_1_1
[7] => SoilCO2_West_A_1
[8] => SoilCO2_West_B_1
[9] => SoilCO2_West_C_1
[10] => SoilCO2_1
[11] => SoilCO2_2
[12] => Tower_2
[13] => Floor_South_2
[14] => Floor_East_2
[15] => Floor_West_2
[16] => Soil_Transect_4_2
[17] => Soil_Transect_3_2
[18] => Soil_Transect_2_2
[19] => Soil_Transect_1_2
[20] => SoilCO2_West_A_2
[21] => SoilCO2_West_B_2
[22] => SoilCO2_West_C_2
[23] => SoilCO2_3
[24] => Tower_3
[25] => Floor_South_3
[26] => Floor_East_3
[27] => Floor_West_3
[28] => Soil_Transect_4_3
[29] => Soil_Transect_3_3
[30] => Soil_Transect_2_3
[31] => Soil_Transect_1_3
[32] => SoilCO2_West_B_3
[33] => SoilCO2_West_C_3
[34] => SoilCO2_4
[35] => Tower_4
[36] => Floor_South_4
[37] => Floor_East_4
[38] => Floor_West_4
[39] => Soil_Transect_4_4
[40] => Soil_Transect_3_4
[41] => Soil_Transect_2_4
[42] => Soil_Transect_1_4
[43] => SoilCO2_West_A_4
[44] => SoilCO2_West_B_4
[45] => SoilCO2_West_C_4
[46] => Soil_Transect_4_1
)
| Date | DOY | Rep | Depth | Tower_1 |
Floor_South_1 |
Floor_East_1 |
Floor_West_1 |
Soil_Transect_3_1 |
Soil_Transect_2_1 |
Soil_Transect_1_1 |
SoilCO2_West_A_1 |
SoilCO2_West_B_1 |
SoilCO2_West_C_1 |
SoilCO2_1 |
SoilCO2_2 |
Tower_2 |
Floor_South_2 |
Floor_East_2 |
Floor_West_2 |
Soil_Transect_4_2 |
Soil_Transect_3_2 |
Soil_Transect_2_2 |
Soil_Transect_1_2 |
SoilCO2_West_A_2 |
SoilCO2_West_B_2 |
SoilCO2_West_C_2 |
SoilCO2_3 |
Tower_3 |
Floor_South_3 |
Floor_East_3 |
Floor_West_3 |
Soil_Transect_4_3 |
Soil_Transect_3_3 |
Soil_Transect_2_3 |
Soil_Transect_1_3 |
SoilCO2_West_B_3 |
SoilCO2_West_C_3 |
SoilCO2_4 |
Tower_4 |
Floor_South_4 |
Floor_East_4 |
Floor_West_4 |
Soil_Transect_4_4 |
Soil_Transect_3_4 |
Soil_Transect_2_4 |
Soil_Transect_1_4 |
SoilCO2_West_A_4 |
SoilCO2_West_B_4 |
SoilCO2_West_C_4 |
Soil_Transect_4_1 |
Avg | Spacial Count |
Measurement Count |
|---|---|---|---|---|---|---|---|---|---|---|---|---|---|---|---|---|---|---|---|---|---|---|---|---|---|---|---|---|---|---|---|---|---|---|---|---|---|---|---|---|---|---|---|---|---|---|---|---|---|---|---|---|---|
| 2015-11-20 | 324 | 0 | nan | 10.6 | 11.2 | 27.9 | 20.9 | 11.5 | 8.8 | 11.5 | 12.4 | 14.7 | 11.8 | 15.6 | 13.6 | 10 | 7.2 | 16.7 | 10 | 13.6 | 22.5 | 13.6 | 4.5 | 11.1 | 7.9 | 16.1 | 11.1 | 13.7 | 5.6 | 7.6 | 5 | 8.1 | 11.1 | 15.1 | 12.9 | 14.5 | 12.9 | 17.6 | 9 | 3.9 | 14.2 | 27.9 | 9.9 | 15 | 19.9 | 10.5 | 14.2 | 11 | 17 | ||||
| 2015-11-20 | 324 | 1 | nan | 10.6 | 12.4 | 26.1 | 19.7 | 11.5 | 8.6 | 11.5 | 12.4 | 15.3 | 11.5 | 15.9 | 13.6 | 10.3 | 6.6 | 18.5 | 10.6 | 13.6 | 22.5 | 13.3 | 3.9 | 11.1 | 7.8 | 16.7 | 7 | 13.4 | 5.6 | 9.8 | 6.2 | 9 | 12 | 15.1 | 12.5 | 14.3 | 12.6 | 15.9 | 8.7 | 3.6 | 13.9 | 24.8 | 11.3 | 14.5 | 19.3 | 9.9 | 12.8 | 11.6 | 15.3 | 10.3 | |||
| 2015-11-20 | 324 | Avg | 0-15cm | 0 | 0 | ||||||||||||||||||||||||||||||||||||||||||||||||
| 2015-11-20 | 324 | Avg | 15-30cm | 0 | 0 | ||||||||||||||||||||||||||||||||||||||||||||||||
| 2015-11-20 | 324 | Avg | 30-45cm | 0 | 0 | ||||||||||||||||||||||||||||||||||||||||||||||||
| 2015-11-20 | 324 | Avg | 45-60cm | 0 | 0 |
mode = both
Moisture Point Probes VR
Array
(
[0] => Solar_Panels_1
[1] => Flux_Tower_1
[2] => Gate_1
[3] => Biomass_Cage_1
[4] => Solar_Panels_2
[5] => Flux_Tower_2
[6] => Gate_2
[7] => Biomass_Cage_2
[8] => Solar_Panels_3
[9] => Flux_Tower_3
[10] => Gate_3
[11] => Biomass_Cage_3
[12] => Solar_Panels_4
[13] => Flux_Tower_4
[14] => Gate_4
[15] => Biomass_Cage_4
)
| Date | DOY | Rep | Depth | Solar_Panels_1 |
Flux_Tower_1 |
Gate_1 |
Biomass_Cage_1 |
Solar_Panels_2 |
Flux_Tower_2 |
Gate_2 |
Biomass_Cage_2 |
Solar_Panels_3 |
Flux_Tower_3 |
Gate_3 |
Biomass_Cage_3 |
Solar_Panels_4 |
Flux_Tower_4 |
Gate_4 |
Biomass_Cage_4 |
Avg | Spacial Count |
Measurement Count |
|---|---|---|---|---|---|---|---|---|---|---|---|---|---|---|---|---|---|---|---|---|---|---|
| 2015-11-20 | 324 | 0 | nan | 11.5 | 13.2 | 10.9 | 4.5 | 18.8 | 17.3 | 11.2 | 10.3 | 17.6 | 7 | 11.5 | 13.1 | 26.5 | 13.9 | 10.5 | 15 | |||
| 2015-11-20 | 324 | 1 | nan | 11.8 | 13.2 | 11.8 | 4.2 | 17.2 | 17.3 | 11.5 | 10.6 | 17 | 6.7 | 12.3 | 14.3 | 25.9 | 13.3 | 9 | 14.2 | |||
| 2015-11-20 | 324 | Avg | 0-15cm | 0 | 0 | |||||||||||||||||
| 2015-11-20 | 324 | Avg | 15-30cm | 0 | 0 | |||||||||||||||||
| 2015-11-20 | 324 | Avg | 30-45cm | 0 | 0 | |||||||||||||||||
| 2015-11-20 | 324 | Avg | 45-60cm | 0 | 0 |
No TZ grass heigth found
No VR grass heigth found
No VR Tree DBH found
No water potential data found
No VR Grass Biomass data found
No VR OakLeaves Biomass data found
No VR PineNeedles Biomass data found
1 photos found
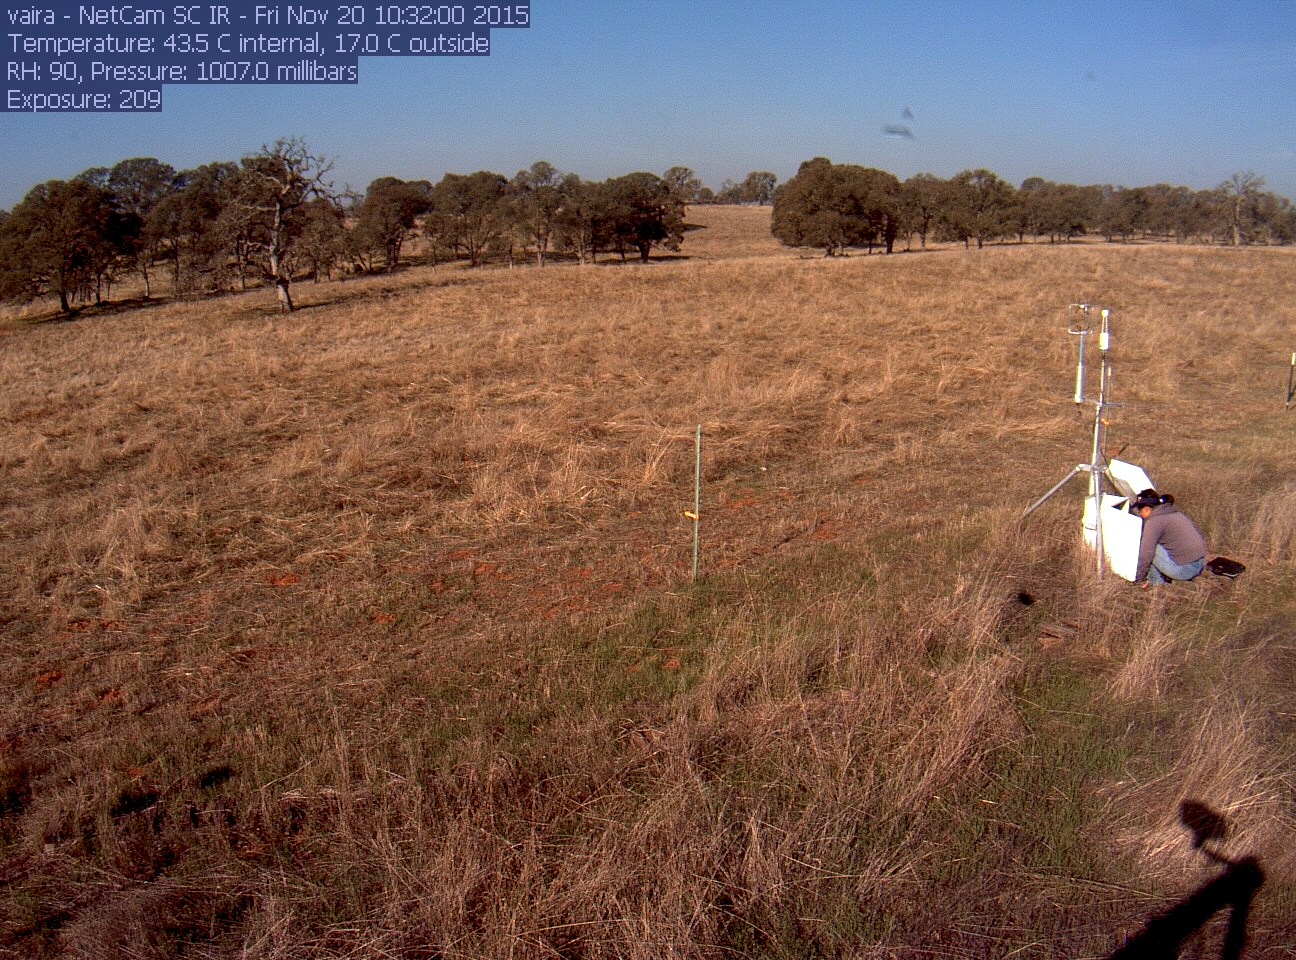
vaira_2015_11_20_103137.jpg ( 2015-11-20 10:21:36 ) Full size: 1296x960
Siyan on site
9 sets found
16 VR_met graphs found
2 VR_flux graphs found
6 VR_soilco2 graphs found
No data found for VR_pond.
Can't check TZVR_mixed
No data found for VR_fd.
No data found for VR_processed.
No data found for VR_arable.
No data found for VR_soilvue.