
Field Notes
<--2015-11-20 10:00:00 | 2015-12-23 09:30:00-->Other sites visited today: Tonzi | Tonzi
Phenocam link: Searching...
Vaira: 2015-12-02 09:30:00 (DOY 336)
Author: Joe Verfaillie
Others: Siyan
Summary: New Raspberry Pi card, replaced two Peltire SHF chips removed another for repair, took panorama photos, missed soil co2 data.
| Varia 2015-12-02 I arrived about 9:30 with Siyan. It was cool and partly cloudy with a variable breeze. It doesn’t look like there has been any rain since last visit – the ground surface is dry. The remaining leaves on the trees have yellowed, probably got frosted. I put a new card into the Raspberry Pi. This one was missing a lot of settings. It only had the FTP server and telnet, but it is a newer version of the OS. The screen size needs to be set to match the screen in the field. As it is now much of the desktop can not be seen on the screen. Also there is no interface to get the time from the CR1000. I think the Pi is using UTC right now, but the Phenocam images should have the local time in the file name. It seemed to be collecting images though. I spliced two Peltier SHF chips (sn P03 and sn P04) back onto the wires. Hopefully the wires on these are sealed better now. I also redid the ends on TCs 1, 2 and 3. We discovered a wire on Peltier SHF chip 1 was broken. I removed sn P01 for repair in the lab. It was not clear if this break is due to corrosion or varmint damage. We cam back later on the way home after the sealant had dried a bit and reburied everything. P01 – removed, TC01 at -2cm P02, TC2 at -4cm P03, TC3 at -8cm P04, TC4 at -16cm P05, TC5 undisturbed at -32cm We also took a bunch of photos with the new Ricoh Theta S camera that takes 360x180 degree panoramas. These should be posted soon in a Google Street View like form. I think we collected met data twice instead of the soil co2 data. The data in the soil co2 file was not the soil co2 data at least. We need to collect all soil co2 data next time. |
Field Data
No tank data
Well Depth
| Date | Location | Depth (feet) |
|---|---|---|
| 2015-12-02 | TZ_floor | 32 |
| 2015-12-02 | TZ_road | 39.8 |
| 2015-12-02 | TZ_tower | 36.6 |
mode = both
Moisture Point Probes TZ
Array
(
[0] => Tower_1
[1] => Floor_South_1
[2] => Floor_East_1
[3] => Floor_West_1
[4] => SoilCO2_1
[5] => Soil_Transect_4_1
[6] => Soil_Transect_3_1
[7] => Soil_Transect_2_1
[8] => Soil_Transect_1_1
[9] => SoilCO2_West_A_1
[10] => SoilCO2_West_B_1
[11] => SoilCO2_West_C_1
[12] => Tower_2
[13] => Floor_South_2
[14] => Floor_East_2
[15] => Floor_West_2
[16] => SoilCO2_2
[17] => Soil_Transect_4_2
[18] => Soil_Transect_3_2
[19] => Soil_Transect_2_2
[20] => Soil_Transect_1_2
[21] => SoilCO2_West_A_2
[22] => SoilCO2_West_B_2
[23] => SoilCO2_West_C_2
[24] => Tower_3
[25] => Floor_South_3
[26] => Floor_East_3
[27] => Floor_West_3
[28] => SoilCO2_3
[29] => Soil_Transect_4_3
[30] => Soil_Transect_3_3
[31] => Soil_Transect_2_3
[32] => Soil_Transect_1_3
[33] => SoilCO2_West_A_3
[34] => SoilCO2_West_B_3
[35] => SoilCO2_West_C_3
[36] => Tower_4
[37] => Floor_South_4
[38] => Floor_East_4
[39] => Floor_West_4
[40] => SoilCO2_4
[41] => Soil_Transect_4_4
[42] => Soil_Transect_3_4
[43] => Soil_Transect_2_4
[44] => Soil_Transect_1_4
[45] => SoilCO2_West_A_4
[46] => SoilCO2_West_B_4
[47] => SoilCO2_West_C_4
)
| Date | DOY | Rep | Depth | Tower_1 |
Floor_South_1 |
Floor_East_1 |
Floor_West_1 |
SoilCO2_1 |
Soil_Transect_4_1 |
Soil_Transect_3_1 |
Soil_Transect_2_1 |
Soil_Transect_1_1 |
SoilCO2_West_A_1 |
SoilCO2_West_B_1 |
SoilCO2_West_C_1 |
Tower_2 |
Floor_South_2 |
Floor_East_2 |
Floor_West_2 |
SoilCO2_2 |
Soil_Transect_4_2 |
Soil_Transect_3_2 |
Soil_Transect_2_2 |
Soil_Transect_1_2 |
SoilCO2_West_A_2 |
SoilCO2_West_B_2 |
SoilCO2_West_C_2 |
Tower_3 |
Floor_South_3 |
Floor_East_3 |
Floor_West_3 |
SoilCO2_3 |
Soil_Transect_4_3 |
Soil_Transect_3_3 |
Soil_Transect_2_3 |
Soil_Transect_1_3 |
SoilCO2_West_A_3 |
SoilCO2_West_B_3 |
SoilCO2_West_C_3 |
Tower_4 |
Floor_South_4 |
Floor_East_4 |
Floor_West_4 |
SoilCO2_4 |
Soil_Transect_4_4 |
Soil_Transect_3_4 |
Soil_Transect_2_4 |
Soil_Transect_1_4 |
SoilCO2_West_A_4 |
SoilCO2_West_B_4 |
SoilCO2_West_C_4 |
Avg | Spacial Count |
Measurement Count |
|---|---|---|---|---|---|---|---|---|---|---|---|---|---|---|---|---|---|---|---|---|---|---|---|---|---|---|---|---|---|---|---|---|---|---|---|---|---|---|---|---|---|---|---|---|---|---|---|---|---|---|---|---|---|---|
| 2015-12-02 | 336 | 0 | nan | 8.8 | 12.7 | 21.2 | 17.6 | 13.4 | 10.6 | 9.1 | 9.1 | 10.6 | 16.2 | 16.5 | 9.4 | 11.2 | 6.6 | 18.2 | 8.7 | 13 | 12.1 | 21.9 | 13.9 | 3.2 | 27.1 | 6 | 15.2 | 14.3 | 4.8 | 10.3 | 3.9 | 3.9 | 8.7 | 10.6 | 14.5 | 12 | 21.8 | 14 | 12.6 | 9.9 | 4.4 | 21.6 | 8.7 | 17 | 9.9 | 15.9 | 18.5 | 10.2 | 13 | 11 | 15.6 | |||
| 2015-12-02 | 336 | 1 | nan | 9.1 | 12.7 | 23.2 | 18.5 | 11.1 | 10 | 10 | 9.1 | 10.3 | 15.9 | 10.3 | 11.2 | 6.6 | 19.4 | 9 | 13.9 | 11.8 | 21.6 | 13.9 | 4.2 | 6 | 14.8 | 14.8 | 5 | 11.7 | 3.7 | 5.3 | 8.4 | 10.9 | 14.8 | 12.6 | 14.8 | 12.9 | 8.5 | 3.6 | 21.1 | 7.9 | 16.2 | 9.9 | 13.9 | 18.5 | 10.7 | 10.1 | 15.6 | |||||||
| 2015-12-02 | 336 | Avg | 0-15cm | 0 | 0 | |||||||||||||||||||||||||||||||||||||||||||||||||
| 2015-12-02 | 336 | Avg | 15-30cm | 0 | 0 | |||||||||||||||||||||||||||||||||||||||||||||||||
| 2015-12-02 | 336 | Avg | 30-45cm | 0 | 0 | |||||||||||||||||||||||||||||||||||||||||||||||||
| 2015-12-02 | 336 | Avg | 45-60cm | 0 | 0 |
mode = both
Moisture Point Probes VR
Array
(
[0] => Solar_Panels_1
[1] => Flux_Tower_1
[2] => Gate_1
[3] => Biomass_Cage_1
[4] => Solar_Panels_2
[5] => Flux_Tower_2
[6] => Gate_2
[7] => Biomass_Cage_2
[8] => Solar_Panels_3
[9] => Flux_Tower_3
[10] => Gate_3
[11] => Biomass_Cage_3
[12] => Solar_Panels_4
[13] => Flux_Tower_4
[14] => Gate_4
[15] => Biomass_Cage_4
)
| Date | DOY | Rep | Depth | Solar_Panels_1 |
Flux_Tower_1 |
Gate_1 |
Biomass_Cage_1 |
Solar_Panels_2 |
Flux_Tower_2 |
Gate_2 |
Biomass_Cage_2 |
Solar_Panels_3 |
Flux_Tower_3 |
Gate_3 |
Biomass_Cage_3 |
Solar_Panels_4 |
Flux_Tower_4 |
Gate_4 |
Biomass_Cage_4 |
Avg | Spacial Count |
Measurement Count |
|---|---|---|---|---|---|---|---|---|---|---|---|---|---|---|---|---|---|---|---|---|---|---|
| 2015-12-02 | 336 | 0 | nan | 0.9 | 12.4 | 11.8 | 4.5 | 18.2 | 16.4 | 10.9 | 10.6 | 17.6 | 7.6 | 12 | 16.2 | 26.8 | 14.2 | 10.1 | 14.2 | |||
| 2015-12-02 | 336 | 1 | nan | 3.3 | 12.1 | 10.6 | 4.7 | 18.2 | 26.4 | 10.6 | 10 | 17.9 | 7 | 11.7 | 15.4 | 26.8 | 13 | 10.5 | 13.9 | |||
| 2015-12-02 | 336 | Avg | 0-15cm | 0 | 0 | |||||||||||||||||
| 2015-12-02 | 336 | Avg | 15-30cm | 0 | 0 | |||||||||||||||||
| 2015-12-02 | 336 | Avg | 30-45cm | 0 | 0 | |||||||||||||||||
| 2015-12-02 | 336 | Avg | 45-60cm | 0 | 0 |
No TZ grass heigth found
No VR grass heigth found
No VR Tree DBH found
No water potential data found
No VR Grass Biomass data found
No VR OakLeaves Biomass data found
No VR PineNeedles Biomass data found
1 photos found
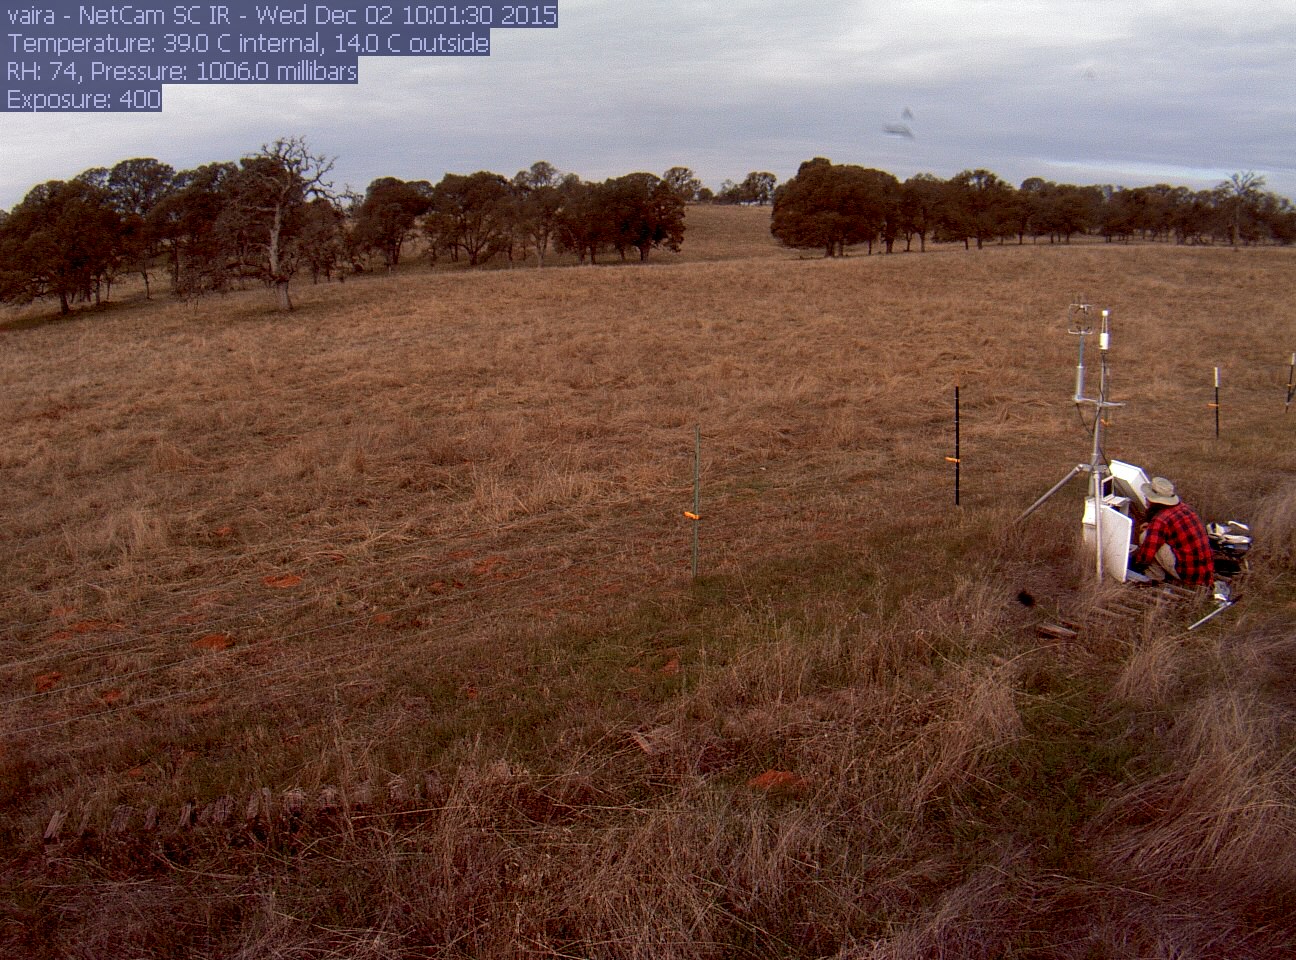
vaira_2015_12_02_100159.jpg ( 2015-12-02 16:13:42 ) Full size: 1296x960
Joe on site
9 sets found
16 VR_met graphs found
2 VR_flux graphs found
6 VR_soilco2 graphs found
No data found for VR_pond.
Can't check TZVR_mixed
No data found for VR_fd.
No data found for VR_processed.
No data found for VR_arable.
No data found for VR_soilvue.