
Field Notes
<--2015-10-01 09:00:00 | 2015-11-20 10:00:00-->Other sites visited today: Tonzi | Tonzi
Phenocam link: Searching...
Vaira: 2015-11-03 09:00:00 (DOY 307)
Author: Joe Verfaillie
Others: Siyan
Summary: Ground is wet from rain, swapped 7500, grass has sprouted, swapped two Vaisala probes.
| Vaira 2015-11-03 I arrived about 9am with Siyan. It was mostly cloudy and cool with a light breeze. There was fog at lower elevations and to the north. Monday’s rain has thoroughly wetted the ground. There are some puddles on the road, but the water hole is still empty. I think most of the rain went straight into the ground. Annuals have sprouted and the grass is almost 5cm high. The cover is spotty though with low, shaded or areas with heavy litter showing the most green while other areas are still almost bare. I downloaded data while Siyan did moisture point, clip plots and tried to do spectral measurements, but the light was variable. The 7500 was swapped: sn 0976 came off and sn 0041 went on. I swapped a couple of Vaisala probes as well. North 4cm: sn G0230061 out, sn L2010068 in North 8cm: sn Y1950005 out, sn L2010070 in Two of the Peltier soil heat flux plates have stopped reporting. I don’t see any problems in the cables above ground. After it rains a little more, I’ll dig them up to check on them. One guy wire on the tower can be reinstalled when the ground gets a bit wetter too. |
Field Data
No tank data
Well Depth
| Date | Location | Depth (feet) |
|---|---|---|
| 2015-11-03 | TZ_floor | 31.8 |
| 2015-11-03 | TZ_road | 40 |
| 2015-11-03 | TZ_tower | 37.5 |
mode = both
Moisture Point Probes TZ
Array
(
[0] => Tower_1
[1] => Floor_South_1
[2] => Floor_East_1
[3] => Floor_West_1
[4] => SoilCO2_1
[5] => Soil_Transect_4_1
[6] => Soil_Transect_3_1
[7] => Soil_Transect_2_1
[8] => Soil_Transect_1_1
[9] => SoilCO2_West_A_1
[10] => SoilCO2_West_B_1
[11] => SoilCO2_West_C_1
[12] => Tower_2
[13] => Floor_South_2
[14] => Floor_East_2
[15] => Floor_West_2
[16] => SoilCO2_2
[17] => Soil_Transect_4_2
[18] => Soil_Transect_3_2
[19] => Soil_Transect_2_2
[20] => Soil_Transect_1_2
[21] => SoilCO2_West_A_2
[22] => SoilCO2_West_B_2
[23] => SoilCO2_West_C_2
[24] => Tower_3
[25] => Floor_South_3
[26] => Floor_East_3
[27] => Floor_West_3
[28] => SoilCO2_3
[29] => Soil_Transect_4_3
[30] => Soil_Transect_3_3
[31] => Soil_Transect_2_3
[32] => Soil_Transect_1_3
[33] => SoilCO2_West_A_3
[34] => SoilCO2_West_B_3
[35] => SoilCO2_West_C_3
[36] => Tower_4
[37] => Floor_South_4
[38] => Floor_East_4
[39] => Floor_West_4
[40] => SoilCO2_4
[41] => Soil_Transect_4_4
[42] => Soil_Transect_3_4
[43] => Soil_Transect_2_4
[44] => Soil_Transect_1_4
[45] => SoilCO2_West_A_4
[46] => SoilCO2_West_B_4
[47] => SoilCO2_West_C_4
)
| Date | DOY | Rep | Depth | Tower_1 |
Floor_South_1 |
Floor_East_1 |
Floor_West_1 |
SoilCO2_1 |
Soil_Transect_4_1 |
Soil_Transect_3_1 |
Soil_Transect_2_1 |
Soil_Transect_1_1 |
SoilCO2_West_A_1 |
SoilCO2_West_B_1 |
SoilCO2_West_C_1 |
Tower_2 |
Floor_South_2 |
Floor_East_2 |
Floor_West_2 |
SoilCO2_2 |
Soil_Transect_4_2 |
Soil_Transect_3_2 |
Soil_Transect_2_2 |
Soil_Transect_1_2 |
SoilCO2_West_A_2 |
SoilCO2_West_B_2 |
SoilCO2_West_C_2 |
Tower_3 |
Floor_South_3 |
Floor_East_3 |
Floor_West_3 |
SoilCO2_3 |
Soil_Transect_4_3 |
Soil_Transect_3_3 |
Soil_Transect_2_3 |
Soil_Transect_1_3 |
SoilCO2_West_A_3 |
SoilCO2_West_B_3 |
SoilCO2_West_C_3 |
Tower_4 |
Floor_South_4 |
Floor_East_4 |
Floor_West_4 |
SoilCO2_4 |
Soil_Transect_4_4 |
Soil_Transect_3_4 |
Soil_Transect_2_4 |
Soil_Transect_1_4 |
SoilCO2_West_A_4 |
SoilCO2_West_B_4 |
SoilCO2_West_C_4 |
Avg | Spacial Count |
Measurement Count |
|---|---|---|---|---|---|---|---|---|---|---|---|---|---|---|---|---|---|---|---|---|---|---|---|---|---|---|---|---|---|---|---|---|---|---|---|---|---|---|---|---|---|---|---|---|---|---|---|---|---|---|---|---|---|---|
| 2015-11-03 | 307 | 0 | nan | 13.5 | 12.7 | 25.3 | 12.1 | 16.2 | 6.8 | 12.4 | 13.2 | 13 | 10.9 | 19.7 | 14.7 | 10 | 7.2 | 6.9 | 7.1 | 12.4 | 11.8 | 13.6 | 10.9 | 4.2 | 19.7 | 3.6 | 11.8 | 14.5 | 5.3 | 7.3 | 10.6 | 6.7 | 8.7 | 9.8 | 14.3 | 12.3 | 17.2 | 15.9 | 12.6 | 8.7 | 3.6 | 15.6 | 11.9 | 18.2 | 9.3 | 15.9 | 20.5 | 10.7 | 13.6 | 11.6 | 15.9 | |||
| 2015-11-03 | 307 | 1 | nan | 13 | 11.5 | 24.4 | 11.8 | 15.1 | 7 | 12.4 | 13 | 12.7 | 10 | 19.7 | 15 | 10.9 | 7.2 | 8.7 | 9.7 | 12.1 | 11.8 | 14.5 | 11.2 | 3.9 | 20.8 | 3.5 | 12.1 | 14.3 | 5 | 8.4 | 12.3 | 7 | 7.8 | 10.6 | 15.4 | 12.9 | 18.8 | 16.2 | 13.1 | 9 | 3.9 | 15.6 | 10.5 | 17 | 10.2 | 15 | 20.5 | 10.5 | 13.3 | 13 | 16.5 | |||
| 2015-11-03 | 307 | Avg | 0-15cm | 0 | 0 | |||||||||||||||||||||||||||||||||||||||||||||||||
| 2015-11-03 | 307 | Avg | 15-30cm | 0 | 0 | |||||||||||||||||||||||||||||||||||||||||||||||||
| 2015-11-03 | 307 | Avg | 30-45cm | 0 | 0 | |||||||||||||||||||||||||||||||||||||||||||||||||
| 2015-11-03 | 307 | Avg | 45-60cm | 0 | 0 |
mode = both
Moisture Point Probes VR
Array
(
[0] => Solar_Panels_1
[1] => Flux_Tower_1
[2] => Gate_1
[3] => Biomass_Cage_1
[4] => Solar_Panels_2
[5] => Flux_Tower_2
[6] => Gate_2
[7] => Biomass_Cage_2
[8] => Solar_Panels_3
[9] => Flux_Tower_3
[10] => Gate_3
[11] => Biomass_Cage_3
[12] => Solar_Panels_4
[13] => Flux_Tower_4
[14] => Gate_4
[15] => Biomass_Cage_4
)
| Date | DOY | Rep | Depth | Solar_Panels_1 |
Flux_Tower_1 |
Gate_1 |
Biomass_Cage_1 |
Solar_Panels_2 |
Flux_Tower_2 |
Gate_2 |
Biomass_Cage_2 |
Solar_Panels_3 |
Flux_Tower_3 |
Gate_3 |
Biomass_Cage_3 |
Solar_Panels_4 |
Flux_Tower_4 |
Gate_4 |
Biomass_Cage_4 |
Avg | Spacial Count |
Measurement Count |
|---|---|---|---|---|---|---|---|---|---|---|---|---|---|---|---|---|---|---|---|---|---|---|
| 2015-11-03 | 307 | 0 | nan | 11.5 | 15 | 12.1 | 5.9 | 13 | 10.9 | 8.1 | 5.7 | 15.1 | 5 | 9.8 | 12 | 26.5 | 13 | 8.2 | 15.3 | |||
| 2015-11-03 | 307 | 1 | nan | 10.9 | 15.3 | 12.1 | 5.9 | 13.3 | 10.3 | 7.8 | 5.1 | 15.1 | 4.5 | 9.2 | 11.2 | 26.5 | 13.3 | 9.9 | 15 | |||
| 2015-11-03 | 307 | Avg | 0-15cm | 0 | 0 | |||||||||||||||||
| 2015-11-03 | 307 | Avg | 15-30cm | 0 | 0 | |||||||||||||||||
| 2015-11-03 | 307 | Avg | 30-45cm | 0 | 0 | |||||||||||||||||
| 2015-11-03 | 307 | Avg | 45-60cm | 0 | 0 |
No TZ grass heigth found
No VR grass heigth found
No VR Tree DBH found
No water potential data found
No VR Grass Biomass data found
No VR OakLeaves Biomass data found
No VR PineNeedles Biomass data found
1 photos found
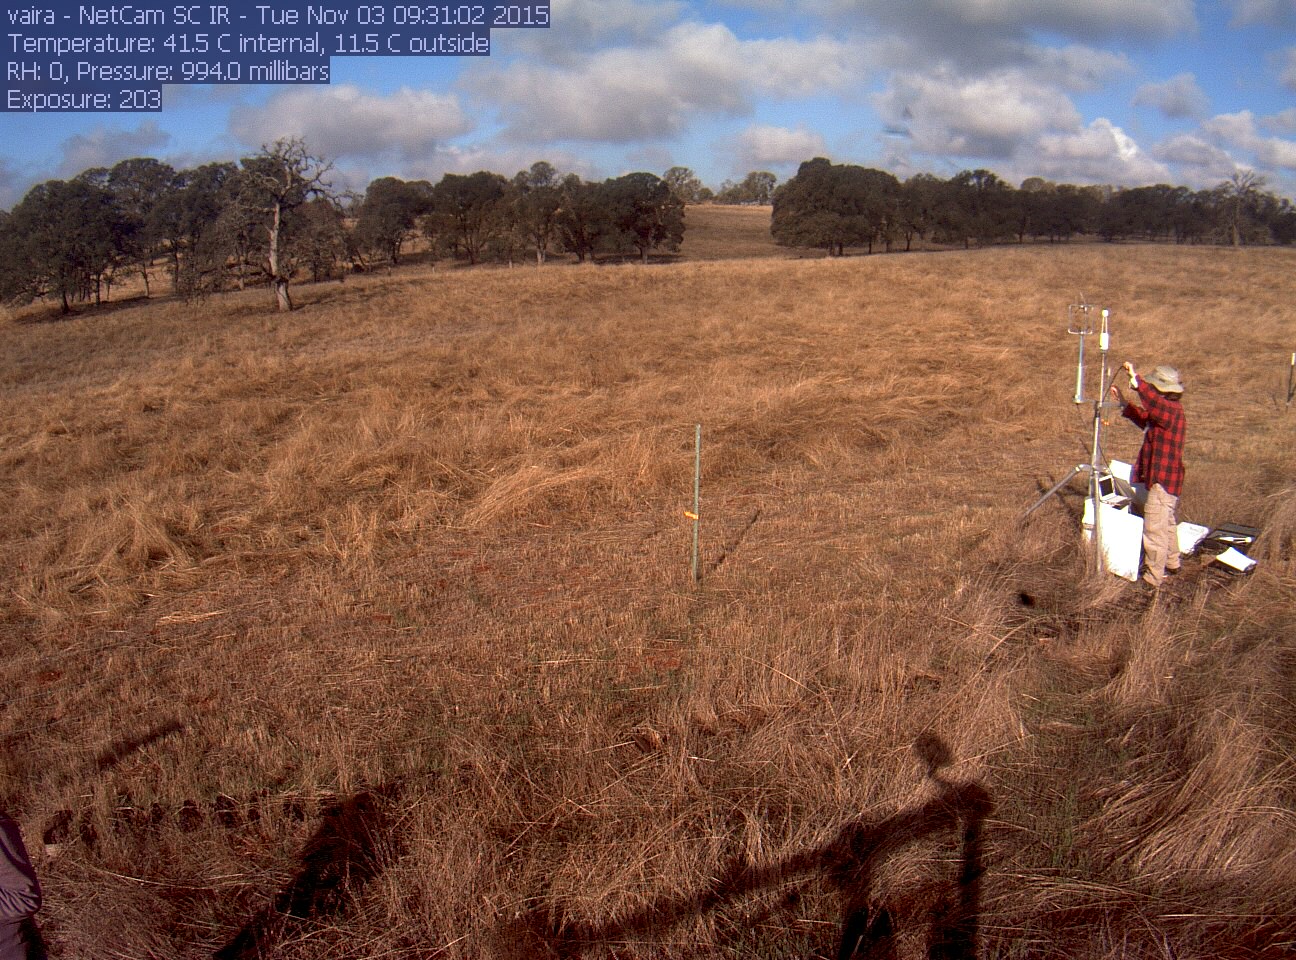
vaira_2015_11_03_093109.jpg ( 2015-11-03 09:21:12 ) Full size: 1296x960
Joe on site
9 sets found
16 VR_met graphs found
2 VR_flux graphs found
6 VR_soilco2 graphs found
No data found for VR_pond.
Can't check TZVR_mixed
No data found for VR_fd.
No data found for VR_processed.
No data found for VR_arable.
No data found for VR_soilvue.