
Field Notes
<--2015-05-06 11:15:00 | 2015-06-03 09:30:00-->Other sites visited today: Vaira
Phenocam link: Searching...
Tonzi: 2015-05-20 11:00:00 (DOY 140)
Author: Joe Verfaillie
Others: Ana
Summary: Another Hander down, fixed power supply on soil co2 10x, tower flux okay, changed tower met program, did not measure wells or dendrometers, clock change on tower computer and IRT system
| Tonzi 2015-05-20 I arrived about 11:00 with Ana. It was clear and sunny with a nice breeze from the west. The grass is still mostly green with lots of flowers and busy bees. The ground is dry but it looks there was some short heavy rain. Ana checked on her IRT and wind profile systems. Another one of the sonics sn 0854 has stopped working. It was the one in the upside down position and might have gotten wet from the rain. The inside was dry, but the connector was wet. Sonic sn 0852 was moved from the second from bottom position to the bottom position. The clock on the IRT CR1000 was four hours ahead. Ana reset it from 8pm to 12:01pm PST. Ana also downloaded the data from the Floor site and measured grass height. She tried to do the well measurements, but the measuring tape sensor was acting up and give variable numbers between 28 and 34ft. I did the Moisture Point measurements. The measurements worked well here with most of the probes reporting reasonable numbers, unlike Vaira today. The top pin of the probe near the Tower was crushed. I had to break it off to get the cable to fit properly. I don’t think that pin is used though. I added a power supply to the soil CO2 10X near Liu Kang’s tree. And plugged the MD9 into the CR23X that had been disconnected some time before. The Floor computer was able to collect the data. I collected data from the Tower computer. Both winflux and the CR1000 were working this time. The Tower computer clock was 10min ahead. This affected the CO2 profile system, the Tram and winflux, but nothing else. When the computer clock read 12:25, I reset it to 12:15. The CO2 profile system was only a few ppm off from calibration. I collected all the Tower top 23x data and loaded a new program. I changed the range on the four-band radiometer from Auto to 50mv and the range on the LED sensors from 5000mv to 1000mv. Hopefully this will fix the spiking we see in the shortwave in numbers. I cleaned the zcam windows but did not collect the images. We did not do the dendrometers or water potential. |
Veg Height (cm): Tape measure from ground to top of plant
20, 30, 20, 10, 10, 30, 10, 50, 30, 20, avg = 23, stdev = 12.52
Field Data
No tank data
No TZ Well data found
mode = both
Moisture Point Probes TZ
Array
(
[0] => Floor_South_1
[1] => Floor_West_1
[2] => SoilCO2_1
[3] => Soil_Transect_4_1
[4] => Soil_Transect_3_1
[5] => Soil_Transect_2_1
[6] => Soil_Transect_1_1
[7] => SoilCO2_West_A_1
[8] => SoilCO2_West_B_1
[9] => SoilCO2_West_C_1
[10] => Tower_2
[11] => Floor_South_2
[12] => Floor_East_2
[13] => SoilCO2_2
[14] => Soil_Transect_4_2
[15] => Soil_Transect_3_2
[16] => Soil_Transect_2_2
[17] => Soil_Transect_1_2
[18] => SoilCO2_West_A_2
[19] => SoilCO2_West_B_2
[20] => SoilCO2_West_C_2
[21] => Tower_3
[22] => Floor_South_3
[23] => SoilCO2_3
[24] => Soil_Transect_4_3
[25] => Soil_Transect_3_3
[26] => Soil_Transect_2_3
[27] => Soil_Transect_1_3
[28] => SoilCO2_West_A_3
[29] => SoilCO2_West_B_3
[30] => SoilCO2_West_C_3
[31] => Tower_4
[32] => Floor_South_4
[33] => Floor_West_4
[34] => SoilCO2_4
[35] => Soil_Transect_4_4
[36] => Soil_Transect_3_4
[37] => Soil_Transect_2_4
[38] => Soil_Transect_1_4
[39] => SoilCO2_West_A_4
[40] => SoilCO2_West_B_4
[41] => SoilCO2_West_C_4
[42] => Floor_West_2
[43] => Floor_West_3
)
| Date | DOY | Rep | Depth | Floor_South_1 |
Floor_West_1 |
SoilCO2_1 |
Soil_Transect_4_1 |
Soil_Transect_3_1 |
Soil_Transect_2_1 |
Soil_Transect_1_1 |
SoilCO2_West_A_1 |
SoilCO2_West_B_1 |
SoilCO2_West_C_1 |
Tower_2 |
Floor_South_2 |
Floor_East_2 |
SoilCO2_2 |
Soil_Transect_4_2 |
Soil_Transect_3_2 |
Soil_Transect_2_2 |
Soil_Transect_1_2 |
SoilCO2_West_A_2 |
SoilCO2_West_B_2 |
SoilCO2_West_C_2 |
Tower_3 |
Floor_South_3 |
SoilCO2_3 |
Soil_Transect_4_3 |
Soil_Transect_3_3 |
Soil_Transect_2_3 |
Soil_Transect_1_3 |
SoilCO2_West_A_3 |
SoilCO2_West_B_3 |
SoilCO2_West_C_3 |
Tower_4 |
Floor_South_4 |
Floor_West_4 |
SoilCO2_4 |
Soil_Transect_4_4 |
Soil_Transect_3_4 |
Soil_Transect_2_4 |
Soil_Transect_1_4 |
SoilCO2_West_A_4 |
SoilCO2_West_B_4 |
SoilCO2_West_C_4 |
Floor_West_2 |
Floor_West_3 |
Avg | Spacial Count |
Measurement Count |
|---|---|---|---|---|---|---|---|---|---|---|---|---|---|---|---|---|---|---|---|---|---|---|---|---|---|---|---|---|---|---|---|---|---|---|---|---|---|---|---|---|---|---|---|---|---|---|---|---|---|---|
| 2015-05-20 | 140 | 0 | nan | 9.1 | 17.3 | 11.1 | 10.3 | 9.1 | 10 | 7.7 | 18.2 | 13.2 | 10.6 | 13.9 | 17.3 | 16.7 | 16.7 | 15.5 | 20.6 | 16.4 | 6.6 | 16.4 | 3.2 | 17.9 | 17.3 | 13.1 | 14.8 | 11.5 | 17 | 19.5 | 16.8 | 17.9 | 17.3 | 16.2 | 11 | 41.4 | 21.1 | 11.1 | 12.8 | 21.3 | 27.4 | 13 | 22.2 | 19.6 | 24.2 | |||||
| 2015-05-20 | 140 | 1 | nan | 8.8 | 17.6 | 11.1 | 10.3 | 9.7 | 9.7 | 8.3 | 17.6 | 13.5 | 10 | 14.5 | 17.6 | 16.7 | 16.4 | 15.2 | 21 | 16.4 | 7.2 | 16.4 | 3.9 | 17.9 | 15.9 | 14 | 13.1 | 11.7 | 16.5 | 19.5 | 16.5 | 18.4 | 17.9 | 15.9 | 11 | 11.9 | 20.8 | 11.1 | 12.2 | 20.8 | 29.1 | 13.3 | 22.8 | 19.9 | 24.2 | 10.3 | 18.2 | |||
| 2015-05-20 | 140 | Avg | 0-15cm | 0 | 0 | |||||||||||||||||||||||||||||||||||||||||||||
| 2015-05-20 | 140 | Avg | 15-30cm | 0 | 0 | |||||||||||||||||||||||||||||||||||||||||||||
| 2015-05-20 | 140 | Avg | 30-45cm | 0 | 0 | |||||||||||||||||||||||||||||||||||||||||||||
| 2015-05-20 | 140 | Avg | 45-60cm | 0 | 0 |
mode = both
Moisture Point Probes VR
Array
(
[0] => Gate_1
[1] => Flux_Tower_2
[2] => Gate_2
[3] => Flux_Tower_3
[4] => Solar_Panels_4
[5] => Flux_Tower_4
[6] => Biomass_Cage_4
[7] => Biomass_Cage_3
)
| Date | DOY | Rep | Depth | Gate_1 |
Flux_Tower_2 |
Gate_2 |
Flux_Tower_3 |
Solar_Panels_4 |
Flux_Tower_4 |
Biomass_Cage_4 |
Biomass_Cage_3 |
Avg | Spacial Count |
Measurement Count |
|---|---|---|---|---|---|---|---|---|---|---|---|---|---|---|
| 2015-05-20 | 140 | 0 | nan | 12.9 | 21.9 | 14.2 | 17.3 | 11.6 | 27.1 | 18.8 | ||||
| 2015-05-20 | 140 | 1 | nan | 12.7 | 21 | 15.2 | 16.8 | 11.9 | 28.2 | 18.2 | ||||
| 2015-05-20 | 140 | Avg | 0-15cm | 0 | 0 | |||||||||
| 2015-05-20 | 140 | Avg | 15-30cm | 0 | 0 | |||||||||
| 2015-05-20 | 140 | Avg | 30-45cm | 0 | 0 | |||||||||
| 2015-05-20 | 140 | Avg | 45-60cm | 0 | 0 |
Grass Height TZ 10
| Date | Height reps (cm) | Location | Average | Samp | STDEV | |||||||||
|---|---|---|---|---|---|---|---|---|---|---|---|---|---|---|
| 2015-05-20 | 20 | 30 | 20 | 10 | 10 | 30 | 10 | 50 | 30 | 20 | GH_ALL | 23 | 10 | 11.87 |
Grass Height VR 15
| Date | Height reps (cm) | Location | Average | Samp | STDEV | ||||||||||||||
|---|---|---|---|---|---|---|---|---|---|---|---|---|---|---|---|---|---|---|---|
| 2015-05-20 | 60 | 70 | 40 | 30 | 30 | 60 | 40 | 90 | 65 | 50 | 20 | 100 | 40 | 50 | 60 | GH_ALL | 53.67 | 15 | 21.33 |
No TZ Tree DBH found
No water potential data found
No TZ Grass Biomass data found
No TZ OakLeaves Biomass data found
No TZ PineNeedles Biomass data found
1 photos found
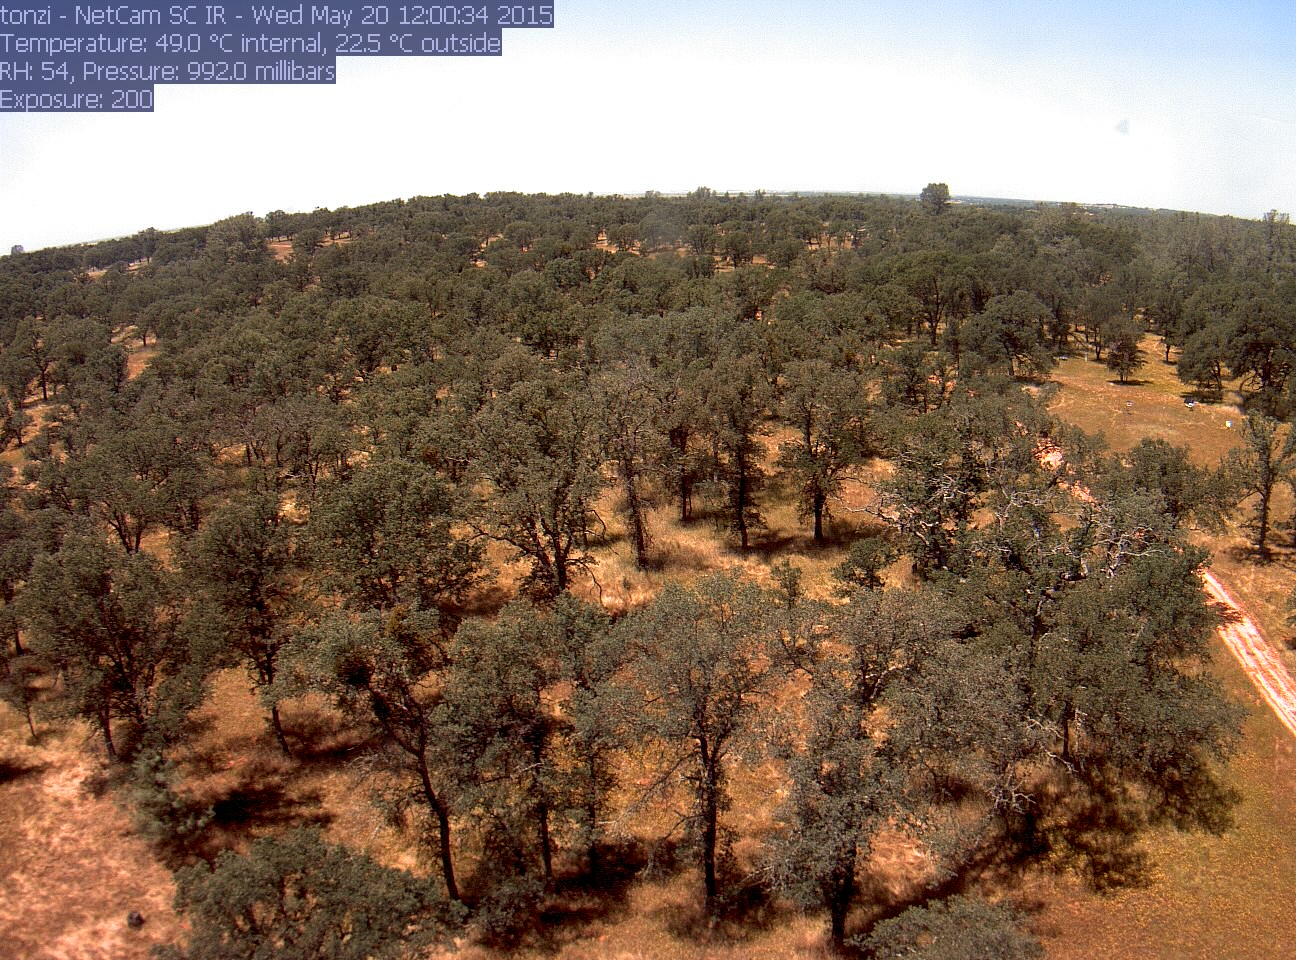
tonzi_2015_05_20_120102.jpg ( 2015-05-20 12:12:02 ) Full size: 1296x960
Still some green grass
16 sets found
No data found for TZ_Fenergy.
11 TZ_tmet graphs found
11 TZ_soilco2 graphs found
Can't check TZ_mixed
3 TZ_mixed graphs found
1 TZ_fflux graphs found
8 TZ_fmet graphs found
1 TZ_tram graphs found
3 TZ_co2prof graphs found
1 TZ_irt graphs found
No data found for TZ_windprof.
1 TZ_tflux graphs found
2 TZ_sm graphs found
Can't check TZ_met
1 TZ_met graphs found
Can't check TZVR_mixed
8 TZ_osu graphs found
No data found for TZ_fd.
Tonzi Z-cam data