
Field Notes
<--2015-05-06 10:30:00 | 2015-07-20 12:50:00-->Other sites visited today: Tonzi
Phenocam link: Searching...
Vaira: 2015-05-20 10:00:00 (DOY 140)
Author: Joe Verfaillie
Others: Ana
Summary: Standard fieldwork, electric fence shorted - fixed, moisture point probes giving mostly bad numbers
| Vaira 2015-05-20 I arrived about 10:00 with Ana. It was mild and mostly sunny with a breeze from the west. The ground was dry, but looked like there might have been some short, heavy rain. The grass is still mostly green and the water hole is close to full. Ana downloaded the data, cleaned the radiation sensors, measured grass height and did the spectral measurements. We did not do clip plots because the grass was still so green. I was going the test the Moisture Point probes, but forgot the cable I needed, so I just did the Moisture Point measurements. Many of the probes were reporting bad numbers especially for the top two locations. I wondered if the cable or box was having problems, but it seemed to work much better at Tonzi. I’m still waiting for the new cable to show up. The electric fence was shorted to the barbed wire. I straightened it out and replace a broken plastic mount. |
Veg Height (cm): Tape measure from ground to top of plant
60, 70, 40, 30, 30, 60, 40, 90, 65, 50, 20, 100, 40, 50, 60, avg = 53.7, stdev = 22.08
Field Data
No tank data
No VR Well data found
mode = both
Moisture Point Probes TZ
Array
(
[0] => Floor_South_1
[1] => Floor_West_1
[2] => SoilCO2_1
[3] => Soil_Transect_4_1
[4] => Soil_Transect_3_1
[5] => Soil_Transect_2_1
[6] => Soil_Transect_1_1
[7] => SoilCO2_West_A_1
[8] => SoilCO2_West_B_1
[9] => SoilCO2_West_C_1
[10] => Tower_2
[11] => Floor_South_2
[12] => Floor_East_2
[13] => SoilCO2_2
[14] => Soil_Transect_4_2
[15] => Soil_Transect_3_2
[16] => Soil_Transect_2_2
[17] => Soil_Transect_1_2
[18] => SoilCO2_West_A_2
[19] => SoilCO2_West_B_2
[20] => SoilCO2_West_C_2
[21] => Tower_3
[22] => Floor_South_3
[23] => SoilCO2_3
[24] => Soil_Transect_4_3
[25] => Soil_Transect_3_3
[26] => Soil_Transect_2_3
[27] => Soil_Transect_1_3
[28] => SoilCO2_West_A_3
[29] => SoilCO2_West_B_3
[30] => SoilCO2_West_C_3
[31] => Tower_4
[32] => Floor_South_4
[33] => Floor_West_4
[34] => SoilCO2_4
[35] => Soil_Transect_4_4
[36] => Soil_Transect_3_4
[37] => Soil_Transect_2_4
[38] => Soil_Transect_1_4
[39] => SoilCO2_West_A_4
[40] => SoilCO2_West_B_4
[41] => SoilCO2_West_C_4
[42] => Floor_West_2
[43] => Floor_West_3
)
| Date | DOY | Rep | Depth | Floor_South_1 |
Floor_West_1 |
SoilCO2_1 |
Soil_Transect_4_1 |
Soil_Transect_3_1 |
Soil_Transect_2_1 |
Soil_Transect_1_1 |
SoilCO2_West_A_1 |
SoilCO2_West_B_1 |
SoilCO2_West_C_1 |
Tower_2 |
Floor_South_2 |
Floor_East_2 |
SoilCO2_2 |
Soil_Transect_4_2 |
Soil_Transect_3_2 |
Soil_Transect_2_2 |
Soil_Transect_1_2 |
SoilCO2_West_A_2 |
SoilCO2_West_B_2 |
SoilCO2_West_C_2 |
Tower_3 |
Floor_South_3 |
SoilCO2_3 |
Soil_Transect_4_3 |
Soil_Transect_3_3 |
Soil_Transect_2_3 |
Soil_Transect_1_3 |
SoilCO2_West_A_3 |
SoilCO2_West_B_3 |
SoilCO2_West_C_3 |
Tower_4 |
Floor_South_4 |
Floor_West_4 |
SoilCO2_4 |
Soil_Transect_4_4 |
Soil_Transect_3_4 |
Soil_Transect_2_4 |
Soil_Transect_1_4 |
SoilCO2_West_A_4 |
SoilCO2_West_B_4 |
SoilCO2_West_C_4 |
Floor_West_2 |
Floor_West_3 |
Avg | Spacial Count |
Measurement Count |
|---|---|---|---|---|---|---|---|---|---|---|---|---|---|---|---|---|---|---|---|---|---|---|---|---|---|---|---|---|---|---|---|---|---|---|---|---|---|---|---|---|---|---|---|---|---|---|---|---|---|---|
| 2015-05-20 | 140 | 0 | nan | 9.1 | 17.3 | 11.1 | 10.3 | 9.1 | 10 | 7.7 | 18.2 | 13.2 | 10.6 | 13.9 | 17.3 | 16.7 | 16.7 | 15.5 | 20.6 | 16.4 | 6.6 | 16.4 | 3.2 | 17.9 | 17.3 | 13.1 | 14.8 | 11.5 | 17 | 19.5 | 16.8 | 17.9 | 17.3 | 16.2 | 11 | 41.4 | 21.1 | 11.1 | 12.8 | 21.3 | 27.4 | 13 | 22.2 | 19.6 | 24.2 | |||||
| 2015-05-20 | 140 | 1 | nan | 8.8 | 17.6 | 11.1 | 10.3 | 9.7 | 9.7 | 8.3 | 17.6 | 13.5 | 10 | 14.5 | 17.6 | 16.7 | 16.4 | 15.2 | 21 | 16.4 | 7.2 | 16.4 | 3.9 | 17.9 | 15.9 | 14 | 13.1 | 11.7 | 16.5 | 19.5 | 16.5 | 18.4 | 17.9 | 15.9 | 11 | 11.9 | 20.8 | 11.1 | 12.2 | 20.8 | 29.1 | 13.3 | 22.8 | 19.9 | 24.2 | 10.3 | 18.2 | |||
| 2015-05-20 | 140 | Avg | 0-15cm | 0 | 0 | |||||||||||||||||||||||||||||||||||||||||||||
| 2015-05-20 | 140 | Avg | 15-30cm | 0 | 0 | |||||||||||||||||||||||||||||||||||||||||||||
| 2015-05-20 | 140 | Avg | 30-45cm | 0 | 0 | |||||||||||||||||||||||||||||||||||||||||||||
| 2015-05-20 | 140 | Avg | 45-60cm | 0 | 0 |
mode = both
Moisture Point Probes VR
Array
(
[0] => Gate_1
[1] => Flux_Tower_2
[2] => Gate_2
[3] => Flux_Tower_3
[4] => Solar_Panels_4
[5] => Flux_Tower_4
[6] => Biomass_Cage_4
[7] => Biomass_Cage_3
)
| Date | DOY | Rep | Depth | Gate_1 |
Flux_Tower_2 |
Gate_2 |
Flux_Tower_3 |
Solar_Panels_4 |
Flux_Tower_4 |
Biomass_Cage_4 |
Biomass_Cage_3 |
Avg | Spacial Count |
Measurement Count |
|---|---|---|---|---|---|---|---|---|---|---|---|---|---|---|
| 2015-05-20 | 140 | 0 | nan | 12.9 | 21.9 | 14.2 | 17.3 | 11.6 | 27.1 | 18.8 | ||||
| 2015-05-20 | 140 | 1 | nan | 12.7 | 21 | 15.2 | 16.8 | 11.9 | 28.2 | 18.2 | ||||
| 2015-05-20 | 140 | Avg | 0-15cm | 0 | 0 | |||||||||
| 2015-05-20 | 140 | Avg | 15-30cm | 0 | 0 | |||||||||
| 2015-05-20 | 140 | Avg | 30-45cm | 0 | 0 | |||||||||
| 2015-05-20 | 140 | Avg | 45-60cm | 0 | 0 |
Grass Height TZ 10
| Date | Height reps (cm) | Location | Average | Samp | STDEV | |||||||||
|---|---|---|---|---|---|---|---|---|---|---|---|---|---|---|
| 2015-05-20 | 20 | 30 | 20 | 10 | 10 | 30 | 10 | 50 | 30 | 20 | GH_ALL | 23 | 10 | 11.87 |
Grass Height VR 15
| Date | Height reps (cm) | Location | Average | Samp | STDEV | ||||||||||||||
|---|---|---|---|---|---|---|---|---|---|---|---|---|---|---|---|---|---|---|---|
| 2015-05-20 | 60 | 70 | 40 | 30 | 30 | 60 | 40 | 90 | 65 | 50 | 20 | 100 | 40 | 50 | 60 | GH_ALL | 53.67 | 15 | 21.33 |
No VR Tree DBH found
No water potential data found
No VR Grass Biomass data found
No VR OakLeaves Biomass data found
No VR PineNeedles Biomass data found
2 photos found
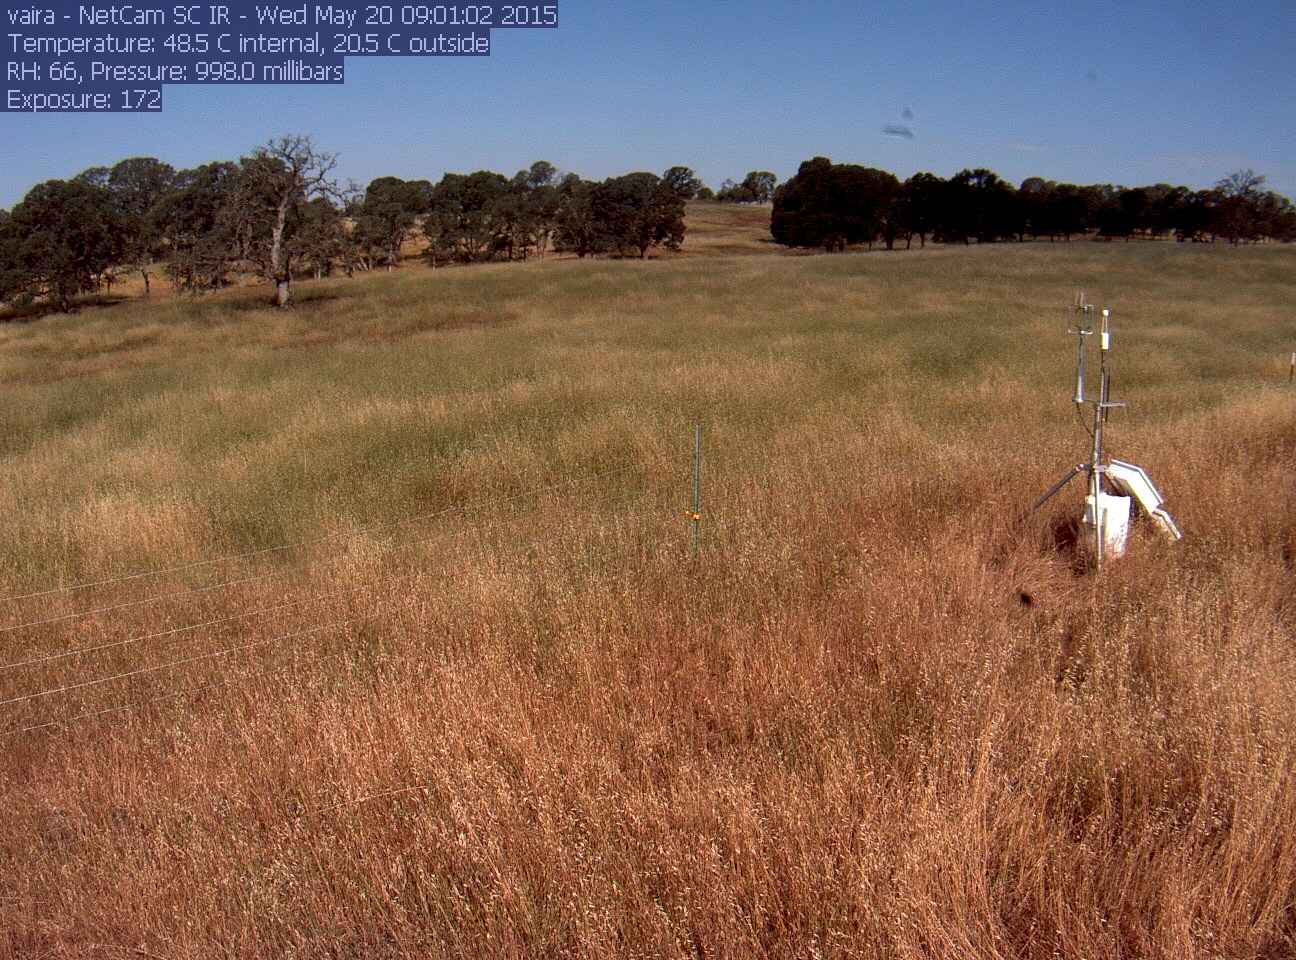
vaira_2015_05_20_090103.jpg ( 2015-05-20 16:53:38 ) Full size: 1296x960
still some green grass
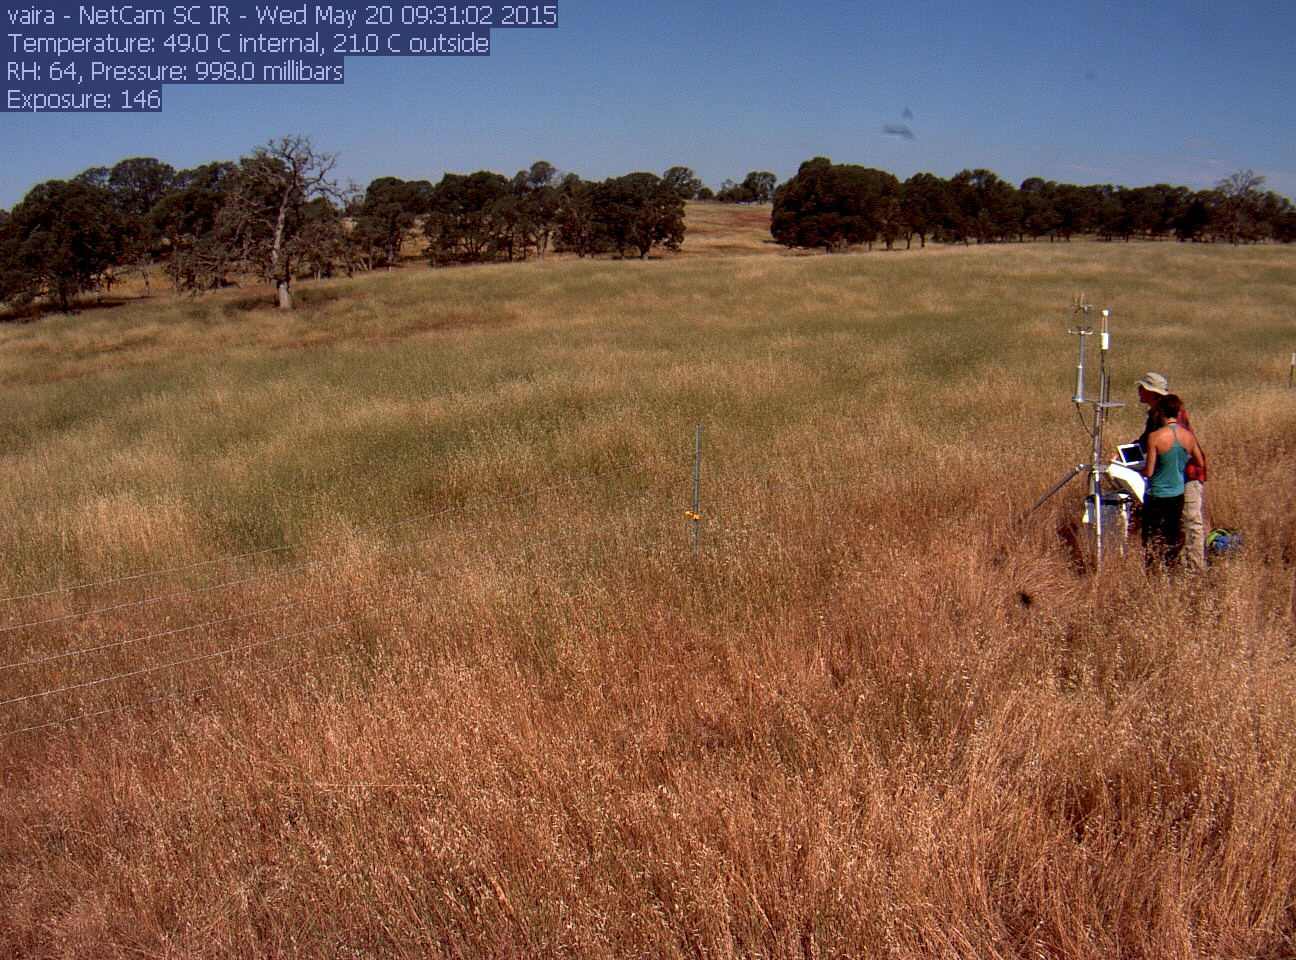
vaira_2015_05_20_093102.jpg ( 2015-05-20 16:23:38 ) Full size: 1296x960
Joe and Ana on site
9 sets found
16 VR_met graphs found
2 VR_flux graphs found
6 VR_soilco2 graphs found
No data found for VR_pond.
Can't check TZVR_mixed
No data found for VR_fd.
No data found for VR_processed.
No data found for VR_arable.
No data found for VR_soilvue.