
Field Notes
<--2015-05-06 10:00:00 | 2015-05-20 11:00:00-->Other sites visited today: Vaira | Tonzi
Phenocam link: Searching...
Tonzi: 2015-05-06 11:15:00 (DOY 126)
Author: Joe Verfaillie
Others: Siyan, Dennis, Ana
Summary: Standard fieldwork, midday water potential, added power converter to Tower sonic, changed Tower CR1000 program, installed two IRT sensors, broken power converter at soil CO2 23X.
| Tonzi 2015-05-06 I arrived about 11:15 with Siyan, Dennis and Ana. It was a beautiful, warm day with a nice breeze. The ground is dry, but the grass is still green in the low spots and there are lots of flowers. I worked on the tower sonic again. The computer and winflux were running but the CR1000 was locked up. Winflux recorded the sonic data but not the 7500 data because the new sonic cable did not have the correct pins for the analog channels. I think the CR1000 was locked up due to changes I made for the diffuse PAR sensor – the differential voltage command was using 60Hz rejection which was taking more than 16ms to run, the scan interval was only 20ms. I change the CR1000 program to do the differential reading using 250us instead. I also added a power converter to the sonic to keep its supply voltage at 12V even when the solar voltage drops to 10V. I made measurements of the rotating shadow band to calculate how much of the sky is blocked. I also made notes of the wiring of the solar panels for possible upgrade of the solar system to 24V. Ana set up a tripod with two IRT sensors on a small tree to the east just north of the road. One sensor, sn 1965, is point down on top of the tree from about 30cm away. The other sensor, sn 1964, is pointed at the ground from about 50cm on a spot cleared of vegetation. The system is running on a CR1000 sn 66249, small solar panel and a sealed 9Ah battery with a charge controller. Dennis did moisture point measurements. He also discovered that the power converter on the soil CO2 CR23X seemed to be dead. He stole the one from the soil CO2 CR10X for the time being. We will get the open and tree 1 data, but not the tree 2 data. Dennis also serviced the zcams. The window on zcam 1 came off. We put it back on ans sealed it with some grease, but it needs new glue next time. Siyan did the standard fieldwork including midday water potential. We check the wind profile system. All sensors were reporting reasonable numbers. We took apart the bottom sensor that was reading bad last time and it was dry inside, but there was a water stain in the plastic connecter. We put a small desiccant pack inside the body when we reassembled it. We did not check the other sensors. |
Field Data
CO2 Profile Tanks
| Date | Tank | Pressure (psi) | ppm |
|---|---|---|---|
| 2015-05-06 | CO2 | 1500 | 405 |
| 2015-05-06 | N2 | 950 | 0 |
Well Depth
| Date | Location | Depth (feet) |
|---|---|---|
| 2015-05-06 | TZ_floor | 27.6 |
| 2015-05-06 | TZ_road | 36.3 |
| 2015-05-06 | TZ_tower | 31.3 |
mode = both
Moisture Point Probes TZ
Array
(
[0] => Tower_1
[1] => Floor_South_1
[2] => Floor_East_1
[3] => Floor_West_1
[4] => SoilCO2_1
[5] => Soil_Transect_4_1
[6] => Soil_Transect_3_1
[7] => Soil_Transect_2_1
[8] => Soil_Transect_1_1
[9] => SoilCO2_West_A_1
[10] => SoilCO2_West_B_1
[11] => SoilCO2_West_C_1
[12] => Tower_2
[13] => Floor_South_2
[14] => Floor_East_2
[15] => Floor_West_2
[16] => SoilCO2_2
[17] => Soil_Transect_4_2
[18] => Soil_Transect_3_2
[19] => Soil_Transect_2_2
[20] => Soil_Transect_1_2
[21] => SoilCO2_West_A_2
[22] => SoilCO2_West_B_2
[23] => SoilCO2_West_C_2
[24] => Tower_3
[25] => Floor_South_3
[26] => Floor_East_3
[27] => Floor_West_3
[28] => SoilCO2_3
[29] => Soil_Transect_4_3
[30] => Soil_Transect_3_3
[31] => Soil_Transect_2_3
[32] => Soil_Transect_1_3
[33] => SoilCO2_West_A_3
[34] => SoilCO2_West_B_3
[35] => SoilCO2_West_C_3
[36] => Tower_4
[37] => Floor_South_4
[38] => Floor_East_4
[39] => Floor_West_4
[40] => SoilCO2_4
[41] => Soil_Transect_4_4
[42] => Soil_Transect_3_4
[43] => Soil_Transect_2_4
[44] => Soil_Transect_1_4
[45] => SoilCO2_West_A_4
[46] => SoilCO2_West_B_4
[47] => SoilCO2_West_C_4
)
| Date | DOY | Rep | Depth | Tower_1 |
Floor_South_1 |
Floor_East_1 |
Floor_West_1 |
SoilCO2_1 |
Soil_Transect_4_1 |
Soil_Transect_3_1 |
Soil_Transect_2_1 |
Soil_Transect_1_1 |
SoilCO2_West_A_1 |
SoilCO2_West_B_1 |
SoilCO2_West_C_1 |
Tower_2 |
Floor_South_2 |
Floor_East_2 |
Floor_West_2 |
SoilCO2_2 |
Soil_Transect_4_2 |
Soil_Transect_3_2 |
Soil_Transect_2_2 |
Soil_Transect_1_2 |
SoilCO2_West_A_2 |
SoilCO2_West_B_2 |
SoilCO2_West_C_2 |
Tower_3 |
Floor_South_3 |
Floor_East_3 |
Floor_West_3 |
SoilCO2_3 |
Soil_Transect_4_3 |
Soil_Transect_3_3 |
Soil_Transect_2_3 |
Soil_Transect_1_3 |
SoilCO2_West_A_3 |
SoilCO2_West_B_3 |
SoilCO2_West_C_3 |
Tower_4 |
Floor_South_4 |
Floor_East_4 |
Floor_West_4 |
SoilCO2_4 |
Soil_Transect_4_4 |
Soil_Transect_3_4 |
Soil_Transect_2_4 |
Soil_Transect_1_4 |
SoilCO2_West_A_4 |
SoilCO2_West_B_4 |
SoilCO2_West_C_4 |
Avg | Spacial Count |
Measurement Count |
|---|---|---|---|---|---|---|---|---|---|---|---|---|---|---|---|---|---|---|---|---|---|---|---|---|---|---|---|---|---|---|---|---|---|---|---|---|---|---|---|---|---|---|---|---|---|---|---|---|---|---|---|---|---|---|
| 2015-05-06 | 126 | 0 | nan | 8.3 | 6.8 | 39.9 | 13.8 | 11.1 | 4.7 | 9.7 | 8.6 | 7.7 | 13.2 | 7.7 | 6.2 | 10.9 | 14.8 | 14.5 | 9 | 14.5 | 12.1 | 16.7 | 16.4 | 6.3 | 12.4 | 2 | 14.8 | 15.6 | 14.5 | 39.6 | 19.8 | 16.5 | 11.5 | 18.2 | 20.9 | 16.5 | 20.4 | 18.4 | 16.5 | 11.9 | 13.6 | 41.4 | 25.6 | 88.7 | 13 | 21.6 | 31.9 | 13.3 | 24.5 | 21.3 | 25.1 | |||
| 2015-05-06 | 126 | 1 | nan | 8 | 6.8 | 39.9 | 13.2 | 11.1 | 4.5 | 10 | 2.1 | 8.6 | 14.4 | 8 | 6.5 | 11.2 | 15.5 | 14.5 | 10.3 | 14.2 | 12.4 | 16.4 | 17 | 6 | 12.7 | 2.3 | 14.5 | 16.5 | 14.8 | 39.6 | 19 | 18.7 | 11.2 | 18.2 | 20.4 | 16.5 | 20.4 | 18.4 | 17.3 | 12.5 | 14.5 | 41.4 | 25.6 | 11.1 | 14.2 | 22.2 | 32.5 | 13.3 | 25.4 | 20.5 | 25.9 | |||
| 2015-05-06 | 126 | 2 | nan | 8 | 6.5 | 39.9 | 11.1 | 11.1 | 9.7 | 8.8 | 7.4 | 13.8 | 8 | 5.6 | 10.9 | 15.2 | 14.8 | 9.7 | 14.8 | 17.3 | 16.7 | 6 | 12.7 | 2 | 14.5 | 16.5 | 14.5 | 39.6 | 19.8 | 16.5 | 18.4 | 20.7 | 16.8 | 19.8 | 18.4 | 17 | 11.6 | 14.5 | 41.4 | 25.6 | 22.4 | 22.8 | 32.2 | 13.6 | 24.8 | 20.5 | 25.9 | |||||||
| 2015-05-06 | 126 | Avg | 0-15cm | 0 | 0 | |||||||||||||||||||||||||||||||||||||||||||||||||
| 2015-05-06 | 126 | Avg | 15-30cm | 0 | 0 | |||||||||||||||||||||||||||||||||||||||||||||||||
| 2015-05-06 | 126 | Avg | 30-45cm | 0 | 0 | |||||||||||||||||||||||||||||||||||||||||||||||||
| 2015-05-06 | 126 | Avg | 45-60cm | 0 | 0 |
mode = both
Moisture Point Probes VR
Array
(
[0] => Solar_Panels_1
[1] => Flux_Tower_1
[2] => Gate_1
[3] => Biomass_Cage_1
[4] => Solar_Panels_2
[5] => Flux_Tower_2
[6] => Gate_2
[7] => Biomass_Cage_2
[8] => Solar_Panels_3
[9] => Flux_Tower_3
[10] => Gate_3
[11] => Biomass_Cage_3
[12] => Solar_Panels_4
[13] => Flux_Tower_4
[14] => Gate_4
[15] => Biomass_Cage_4
)
| Date | DOY | Rep | Depth | Solar_Panels_1 |
Flux_Tower_1 |
Gate_1 |
Biomass_Cage_1 |
Solar_Panels_2 |
Flux_Tower_2 |
Gate_2 |
Biomass_Cage_2 |
Solar_Panels_3 |
Flux_Tower_3 |
Gate_3 |
Biomass_Cage_3 |
Solar_Panels_4 |
Flux_Tower_4 |
Gate_4 |
Biomass_Cage_4 |
Avg | Spacial Count |
Measurement Count |
|---|---|---|---|---|---|---|---|---|---|---|---|---|---|---|---|---|---|---|---|---|---|---|
| 2015-05-06 | 126 | 0 | nan | 39.9 | 39.9 | 4.7 | 39.9 | 50 | 50 | 6.3 | 50 | 16.8 | 39.6 | 39.6 | 39.6 | 41.4 | 13 | 41.4 | 14.5 | |||
| 2015-05-06 | 126 | 1 | nan | 39.9 | 39.9 | 4.7 | 39.9 | 9.7 | 50 | 6.9 | 50 | 17 | 39.6 | 39.6 | 39.6 | 41.4 | 12.6 | 41.4 | 14.2 | |||
| 2015-05-06 | 126 | 2 | nan | 39.9 | 39.9 | 39.9 | 7.2 | 50 | 50 | 15.9 | 39.6 | 39.6 | 41.4 | 12.8 | 14.8 | |||||||
| 2015-05-06 | 126 | Avg | 0-15cm | 0 | 0 | |||||||||||||||||
| 2015-05-06 | 126 | Avg | 15-30cm | 0 | 0 | |||||||||||||||||
| 2015-05-06 | 126 | Avg | 30-45cm | 0 | 0 | |||||||||||||||||
| 2015-05-06 | 126 | Avg | 45-60cm | 0 | 0 |
No TZ grass heigth found
Grass Height VR 22
| Date | Height reps (cm) | Location | Average | Samp | STDEV | |||||||||||||||||||||
|---|---|---|---|---|---|---|---|---|---|---|---|---|---|---|---|---|---|---|---|---|---|---|---|---|---|---|
| 2015-05-06 | 50 | 40 | 37 | 42 | 48 | 62 | 40 | 50 | 68 | 75 | 50 | 54 | 45 | 53 | 25 | 37 | 33 | 33 | 44 | 36 | 78 | 40 | GH_ALL | 47.27 | 22 | 13.32 |
Tree DBH
| Date | Tag# | Reading (mm) |
|---|---|---|
| 2015-05-06 | 102 | 12.0 |
| 2015-05-06 | 2 | 14.5 |
| 2015-05-06 | 245 | 21.5 |
| 2015-05-06 | 3 | 15.3 |
| 2015-05-06 | 4 | 11.5 |
| 2015-05-06 | 5 | 14.2 |
| 2015-05-06 | 7 | 11.8 |
| 2015-05-06 | 72 | 21.0 |
| 2015-05-06 | 79 | 17.5 |
| 2015-05-06 | 8 | 15.5 |
Water Potential - mode: raw
| Time | Species | Tree | readings (bar) | ||
|---|---|---|---|---|---|
| 2015-05-06 12:00:00 | OAK | 102 | -13 | -12 | -14 |
| 2015-05-06 12:00:00 | OAK | 35 | -20 | -23 | -12 |
| 2015-05-06 12:00:00 | OAK | 92 | -22 | -20 | -24 |
| 2015-05-06 12:15:00 | PINE | OLD | -20 | -23 | -4 |
| 2015-05-06 12:15:00 | PINE | YNG | -4 | -5 | -2 |
No TZ Grass Biomass data found
No TZ OakLeaves Biomass data found
No TZ PineNeedles Biomass data found
1 photos found
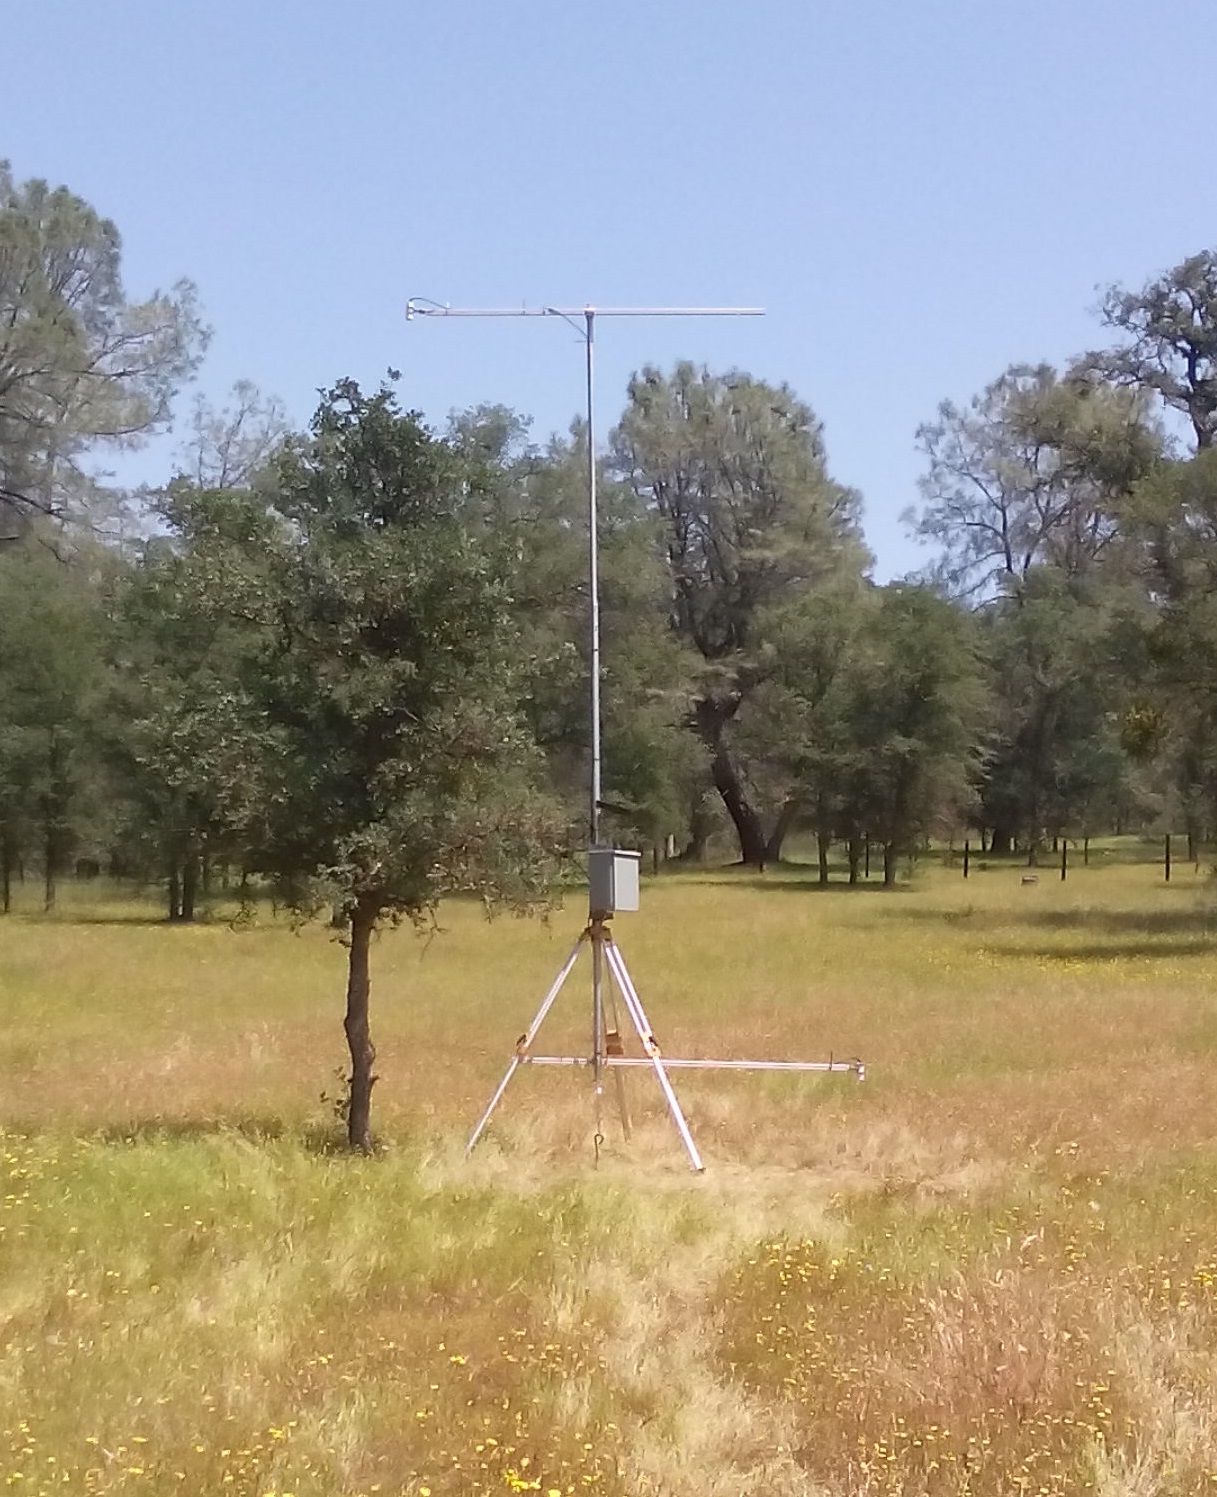
20150506TZ_IRTSensors.jpg ( 2015-05-06 13:31:13 ) Full size: 1217x1497
Two IRT sensors installed, one pointing at the top of a small tree and one pointing at the ground at a spot cleared of vegetation
16 sets found
No data found for TZ_Fenergy.
11 TZ_tmet graphs found
No data found for TZ_soilco2.
Can't check TZ_mixed
3 TZ_mixed graphs found
1 TZ_fflux graphs found
8 TZ_fmet graphs found
1 TZ_tram graphs found
3 TZ_co2prof graphs found
1 TZ_irt graphs found
No data found for TZ_windprof.
1 TZ_tflux graphs found
2 TZ_sm graphs found
Can't check TZ_met
1 TZ_met graphs found
Can't check TZVR_mixed
8 TZ_osu graphs found
No data found for TZ_fd.
Tonzi Z-cam data