Field Notes

<--2015-04-08 10:30:00 | 2015-04-21 09:30:00-->
Phenocam link: Searching...

Tonzi: 2015-04-15 10:00:00 (DOY 105)
Author: Joe Verfaillie
Others:

Summary: Fixed tower sonic, added DIY diffuse PAR, collected data from wind profile

Tonzi
2015-04-15

I arrived about 10am. It was clear, sunny and cool with a breeze from the north. The Delta was super winds. The water level in the Sacramento River near Locke looked unusually low. There was water at Consumnes and lots of flowers. At Tonzi the ground surface was dry, but the grass looked good with flowers starting.

I replaced the cable on the Tower sonic. The old one is in bad shape. I’ll save the connectors and dump the rest. After the swap I still wasn’t getting any data so I swapped the RS422 to 232 converter and that seemed to fix things. I need to test the converter in the lab to make sure that was the problem.

I installed a home brew diffuse PAR sensor at the top of the tower. This sensor uses a rotating shadow band driven by a DC motor and magnetic proximity sensors to detect when the shadow band is horizontal. I removed the CR1000 card and updated the flux program to add the diffuse PAR to that data logger. It will record 10Hz PAR and 30min average of the PAR minimums and the count of those. The PAR sensor is the Ameriflux standard sn 060868.

I checked the BF5 diffuse PAR sensor and it was free of condensation.

I downloaded data from the new wind profile system and added a ground wire to that CR1000. I tried to adjust the lower sonics to be more level.

The Tower computer was running well.

Field Data

No tank data

No TZ Well data found

No TZ Moisture Point data found

No VR Moisture Point data found

No TZ grass heigth found

No VR grass heigth found

No TZ Tree DBH found

No water potential data found

No TZ Grass Biomass data found

No TZ OakLeaves Biomass data found

No TZ PineNeedles Biomass data found

2 photos found
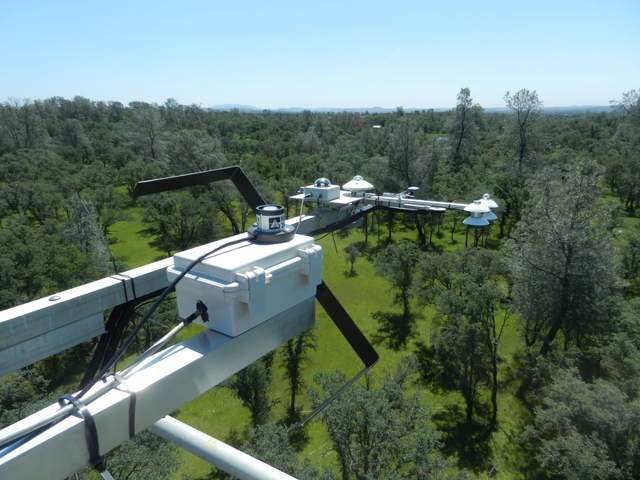
Rotating shadow band for diffuse PAR and radiometers at Tonzi
20150415TZ_DiffusePAR1.jpg ( 2015-04-15 12:50:59 ) Full size: 1920x1440
Rotating shadow band for diffuse PAR and radiometers at Tonzi
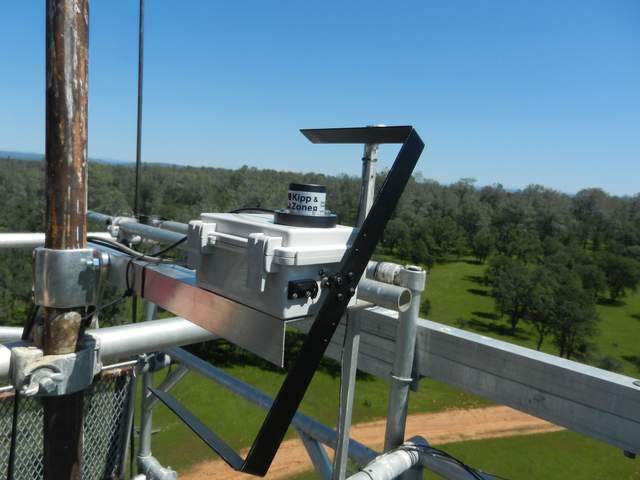
Rotating shadow band for diffuse PAR
20150415TZ_DiffusePAR2.jpg ( 2015-04-15 12:52:05 ) Full size: 1920x1440
Rotating shadow band for diffuse PAR

Graphs display:
16 sets found

No data found for TZ_Fenergy.
11 TZ_tmet graphs found

Explore the graph:Tonzi Tower Met: Temperature and Power in a new window

Explore the graph:Tonzi Tower Met: Solar Radiation in a new window

Explore the graph:Tonzi Tower Met: IRT Sensors in a new window

Explore the graph:LED Sensor Incoming in a new window

Explore the graph:LED Sensor Outgoing in a new window

Explore the graph:4-Band Solar Radiation in a new window

Explore the graph:Air Temperature Profile in a new window

Explore the graph:Relativity Humidity Profile in a new window

Explore the graph:Tonzi Tower PRI in a new window

Explore the graph:SRS PRI/NDVI in a new window

Explore the graph:SRS NDVI in a new window

11 TZ_soilco2 graphs found

Explore the graph:Tonzi Soil CO2 Profile: Open (East) CO2 in a new window

Explore the graph:Tonzi Soil CO2 Profile: Tree (West) CO2 in a new window

Explore the graph:Tonzi Soil CO2 Profile: Open (East) Temperatures in a new window

Explore the graph:Tonzi Soil CO2 Profile: Tree (West) Temperatures in a new window

Explore the graph:Tonzi Soil CO2 Profile: Upper CO2 in a new window

Explore the graph:Tonzi Soil CO2 Profile: Lower CO2 in a new window

Explore the graph:Tonzi Soil CO2 Profile: Upper Temperatures in a new window

Explore the graph:Tonzi Soil CO2 Profile: Lower Temperatures in a new window

Explore the graph:Tonzi Soil CO2 Profile: Power and Temperature in a new window

Explore the graph:Tree 2 Soil CO2 in a new window

Explore the graph:Tree 2 Soil Temperature in a new window

Can't check TZ_mixed
3 TZ_mixed graphs found

Explore the graph:Tonzi PPT in a new window

Explore the graph:Tonzi CO2 and H2O Densities in a new window

Explore the graph:Air Pressure in a new window

1 TZ_fflux graphs found

Explore the graph:Tonzi Wind Speed in a new window

8 TZ_fmet graphs found

Explore the graph:Soil Heat Flux in a new window

Explore the graph:Tonzi Soil Temperature Set A in a new window

Explore the graph:Tonzi Soil Temperatures Set B in a new window

Explore the graph:Tonzi Soil Temperatures Set C in a new window

Explore the graph:Tonzi Soil Temperature Set D in a new window

Explore the graph:Well Level in a new window

Explore the graph:Well Water Temperature in a new window

Explore the graph:Soil Water Potential in a new window

1 TZ_tram graphs found

Explore the graph:Tonzi Tram Incoming PAR in a new window

3 TZ_co2prof graphs found

Explore the graph:Tower CO2 Profile Concentrations in a new window

Explore the graph:Tower CO2 Profile Cell Pressure in a new window

Explore the graph:CO2 Profile Sensor Temperature in a new window

No data found for TZ_irt.
No data found for TZ_windprof.
1 TZ_tflux graphs found

Explore the graph:Tower CO2 and H2O in a new window

2 TZ_sm graphs found

Explore the graph:Floor Solar Radiations in a new window

Explore the graph:TZ Soil Moisture in a new window

Can't check TZ_met
1 TZ_met graphs found

Explore the graph:Floor and Tower RH in a new window

Can't check TZVR_mixed
8 TZ_osu graphs found

Explore the graph:Soil Moisture And Rain in a new window

Explore the graph:SP1 Solar Radiation in a new window

Explore the graph:SP1 Soil Temperature Profile in a new window

Explore the graph:SP1 Soil Heat Flux in a new window

Explore the graph:SP2 Soil Moisture in a new window

Explore the graph:SP2 Soil Temperature in a new window

Explore the graph:SP3 Soil Moisture in a new window

Explore the graph:SP3 Soil Temperature in a new window

No data found for TZ_fd.
Tonzi Z-cam data

plot of Tonzi z-cam LAI

plot of Tonzi z-cam gap fration