
Field Notes
<--2015-04-15 10:00:00 | 2015-04-29 10:00:00-->Phenocam link: Searching...
Tonzi: 2015-04-21 09:30:00 (DOY 111)
Author: Siyan Ma
Others:
Summary: swapped 7500 at Vaira, HMP45 fan at Vaira dead, Tower eddy hung up, couldn't talk to soilco2 cr23x, measured water potential including grass
|
When: Date and Time
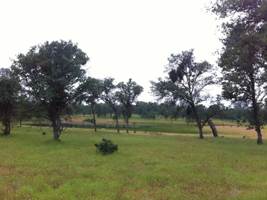
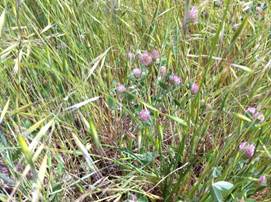
When: Date: 4/21/2015 , Day: 111 , Watch Time: 9:30 am . Where: Tonzi/Vaira Ranch Who: Siyan Weather: cloudy Phenology: a beautiful spring day; grasses still green; lots of yellow and purple flowers
Summary
Vaira_Grass Site
Tonzi_Tower Site
Is the pump running? YES!
9. closed gate and set up fence. YES! Toniz_Floor Site
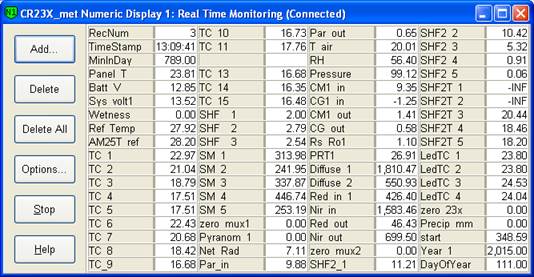
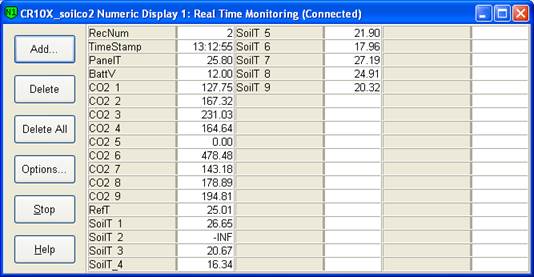
CR23X3 – floor-Met CR23X6 – tower-Met CR10X2 – floor-Met Soil CO2 profile: CR23X5 – soil CO2 profile: Couldn’t be connected from the PC.
|
Veg Height (cm): Tape measure from ground to top of plant
35.5, 38, 43, 23, 33, 30.5, avg = 33.8, stdev = 6.83
Field Data
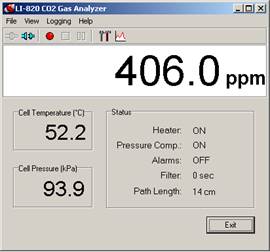
CO2 Profile Tanks
| Date | Tank | Pressure (psi) | ppm |
|---|---|---|---|
| 2015-04-21 | CO2 | 1600 | 405 |
| 2015-04-21 | N2 | 1000 | 0 |
Well Depth
| Date | Location | Depth (feet) |
|---|---|---|
| 2015-04-21 | TZ_floor | 27.5 |
| 2015-04-21 | TZ_road | 36.3 |
| 2015-04-21 | TZ_tower | 34.1 |
mode = both
Moisture Point Probes TZ
Array
(
[0] => Tower_1
[1] => Floor_South_1
[2] => SoilCO2_1
[3] => Soil_Transect_4_1
[4] => Soil_Transect_3_1
[5] => Soil_Transect_2_1
[6] => Soil_Transect_1_1
[7] => SoilCO2_West_A_1
[8] => SoilCO2_West_B_1
[9] => SoilCO2_West_C_1
[10] => Tower_2
[11] => Floor_East_2
[12] => Floor_West_2
[13] => SoilCO2_2
[14] => Soil_Transect_4_2
[15] => Soil_Transect_3_2
[16] => Soil_Transect_2_2
[17] => Soil_Transect_1_2
[18] => SoilCO2_West_A_2
[19] => SoilCO2_West_B_2
[20] => SoilCO2_West_C_2
[21] => Tower_3
[22] => Floor_East_3
[23] => Floor_West_3
[24] => SoilCO2_3
[25] => Soil_Transect_4_3
[26] => Soil_Transect_3_3
[27] => Soil_Transect_2_3
[28] => Soil_Transect_1_3
[29] => SoilCO2_West_A_3
[30] => SoilCO2_West_B_3
[31] => SoilCO2_West_C_3
[32] => Tower_4
[33] => Floor_South_4
[34] => Floor_East_4
[35] => SoilCO2_4
[36] => Soil_Transect_4_4
[37] => Soil_Transect_3_4
[38] => Soil_Transect_2_4
[39] => Soil_Transect_1_4
[40] => SoilCO2_West_A_4
[41] => SoilCO2_West_B_4
[42] => SoilCO2_West_C_4
[43] => Floor_West_1
[44] => Floor_South_2
[45] => Floor_South_3
)
| Date | DOY | Rep | Depth | Tower_1 |
Floor_South_1 |
SoilCO2_1 |
Soil_Transect_4_1 |
Soil_Transect_3_1 |
Soil_Transect_2_1 |
Soil_Transect_1_1 |
SoilCO2_West_A_1 |
SoilCO2_West_B_1 |
SoilCO2_West_C_1 |
Tower_2 |
Floor_East_2 |
Floor_West_2 |
SoilCO2_2 |
Soil_Transect_4_2 |
Soil_Transect_3_2 |
Soil_Transect_2_2 |
Soil_Transect_1_2 |
SoilCO2_West_A_2 |
SoilCO2_West_B_2 |
SoilCO2_West_C_2 |
Tower_3 |
Floor_East_3 |
Floor_West_3 |
SoilCO2_3 |
Soil_Transect_4_3 |
Soil_Transect_3_3 |
Soil_Transect_2_3 |
Soil_Transect_1_3 |
SoilCO2_West_A_3 |
SoilCO2_West_B_3 |
SoilCO2_West_C_3 |
Tower_4 |
Floor_South_4 |
Floor_East_4 |
SoilCO2_4 |
Soil_Transect_4_4 |
Soil_Transect_3_4 |
Soil_Transect_2_4 |
Soil_Transect_1_4 |
SoilCO2_West_A_4 |
SoilCO2_West_B_4 |
SoilCO2_West_C_4 |
Floor_West_1 |
Floor_South_2 |
Floor_South_3 |
Avg | Spacial Count |
Measurement Count |
|---|---|---|---|---|---|---|---|---|---|---|---|---|---|---|---|---|---|---|---|---|---|---|---|---|---|---|---|---|---|---|---|---|---|---|---|---|---|---|---|---|---|---|---|---|---|---|---|---|---|---|---|---|
| 2015-04-21 | 111 | 0 | nan | 8.8 | 5.6 | 22.8 | 10.9 | 9.7 | 4.2 | 8.8 | 14.4 | 10.9 | 6.5 | 11.5 | 18.8 | 11.2 | 23.4 | 14.2 | 19.7 | 19.7 | 6.6 | 15.5 | 2.9 | 17 | 15.4 | 21.2 | 32.9 | 27.1 | 13.1 | 20.1 | 22.3 | 17.3 | 22.6 | 20.1 | 17 | 13.6 | 13.6 | 41.4 | 47.4 | 15.3 | 21.1 | 35.4 | 15 | 31.1 | 26.8 | 27.4 | ||||||
| 2015-04-21 | 111 | 1 | nan | 8.8 | 5.3 | 21.2 | 11.5 | 8.8 | 4.2 | 9.1 | 14.4 | 6.5 | 12.4 | 16.7 | 10.9 | 24.3 | 13.9 | 19.7 | 20 | 6.9 | 15.2 | 16.4 | 15.9 | 21.5 | 29 | 12.6 | 19.3 | 22.1 | 17.9 | 22.1 | 18.4 | 14.2 | 29.4 | 41.4 | 15.6 | 20.8 | 35.1 | 15.3 | 32.8 | 27.6 | 11.1 | 50 | 39.6 | |||||||||
| 2015-04-21 | 111 | Avg | 0-15cm | 0 | 0 | |||||||||||||||||||||||||||||||||||||||||||||||
| 2015-04-21 | 111 | Avg | 15-30cm | 0 | 0 | |||||||||||||||||||||||||||||||||||||||||||||||
| 2015-04-21 | 111 | Avg | 30-45cm | 0 | 0 | |||||||||||||||||||||||||||||||||||||||||||||||
| 2015-04-21 | 111 | Avg | 45-60cm | 0 | 0 |
mode = both
Moisture Point Probes VR
Array
(
[0] => Solar_Panels_1
[1] => Gate_1
[2] => Solar_Panels_2
[3] => Gate_2
[4] => Biomass_Cage_2
[5] => Solar_Panels_3
[6] => Biomass_Cage_3
[7] => Solar_Panels_4
[8] => Flux_Tower_4
[9] => Biomass_Cage_4
)
| Date | DOY | Rep | Depth | Solar_Panels_1 |
Gate_1 |
Solar_Panels_2 |
Gate_2 |
Biomass_Cage_2 |
Solar_Panels_3 |
Biomass_Cage_3 |
Solar_Panels_4 |
Flux_Tower_4 |
Biomass_Cage_4 |
Avg | Spacial Count |
Measurement Count |
|---|---|---|---|---|---|---|---|---|---|---|---|---|---|---|---|---|
| 2015-04-21 | 111 | 0 | nan | 0.1 | 5 | 13.3 | 6.9 | 6.9 | 15.6 | 15.1 | 28.2 | 14.8 | 17.3 | |||
| 2015-04-21 | 111 | 1 | nan | 0.4 | 5 | 13.6 | 7.2 | 6.9 | 16.2 | 15.6 | 28.2 | 17.6 | ||||
| 2015-04-21 | 111 | Avg | 0-15cm | 0 | 0 | |||||||||||
| 2015-04-21 | 111 | Avg | 15-30cm | 0 | 0 | |||||||||||
| 2015-04-21 | 111 | Avg | 30-45cm | 0 | 0 | |||||||||||
| 2015-04-21 | 111 | Avg | 45-60cm | 0 | 0 |
Grass Height TZ 6
| Date | Height reps (cm) | Location | Average | Samp | STDEV | |||||
|---|---|---|---|---|---|---|---|---|---|---|
| 2015-04-21 | 35.5 | 38 | 43 | 23 | 33 | 30.5 | GH_ALL | 33.83 | 6 | 6.24 |
Grass Height VR 9
| Date | Height reps (cm) | Location | Average | Samp | STDEV | ||||||||
|---|---|---|---|---|---|---|---|---|---|---|---|---|---|
| 2015-04-21 | 80 | 36 | 42 | 27 | 31 | 69 | 64 | 53 | 27 | GH_ALL | 47.67 | 9 | 18.55 |
Tree DBH
| Date | Tag# | Reading (mm) |
|---|---|---|
| 2015-04-21 | 1 | 14.2 |
| 2015-04-21 | 102 | 11.1 |
| 2015-04-21 | 2 | 14.1 |
| 2015-04-21 | 245 | 20.7 |
| 2015-04-21 | 3 | 14.6 |
| 2015-04-21 | 4 | 11.0 |
| 2015-04-21 | 5 | 13.6 |
| 2015-04-21 | 7 | 11.3 |
| 2015-04-21 | 72 | 20.5 |
| 2015-04-21 | 79 | 16.7 |
| 2015-04-21 | 8 | 15.0 |
Water Potential - mode: raw
| Time | Species | Tree | readings (bar) | ||
|---|---|---|---|---|---|
| 2015-04-21 10:00:00 | OAK | 102 | -6 | -6 | -6 |
| 2015-04-21 10:15:00 | PINE | OLD | -12 | -4 | |
| 2015-04-21 10:15:00 | PINE | YNG | -4 | -12 | |
| 2015-04-21 13:00:00 | OAK | 102 | -11 | -15 | -13 |
| 2015-04-21 13:15:00 | PINE | OLD | -16 | -17 | |
| 2015-04-21 13:15:00 | PINE | YNG | -10 | -12 | |
No TZ Grass Biomass data found
No TZ OakLeaves Biomass data found
No TZ PineNeedles Biomass data found
0 photos found
16 sets found
No data found for TZ_Fenergy.
11 TZ_tmet graphs found
11 TZ_soilco2 graphs found
Can't check TZ_mixed
3 TZ_mixed graphs found
1 TZ_fflux graphs found
8 TZ_fmet graphs found
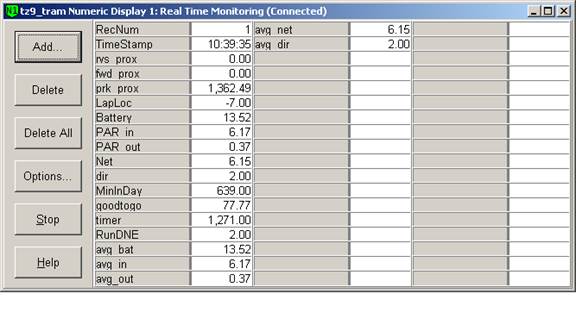
1 TZ_tram graphs found
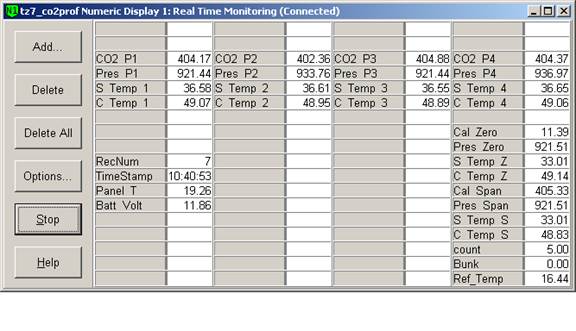
3 TZ_co2prof graphs found
No data found for TZ_irt.
No data found for TZ_windprof.
1 TZ_tflux graphs found
2 TZ_sm graphs found
Can't check TZ_met
1 TZ_met graphs found
Can't check TZVR_mixed
8 TZ_osu graphs found
No data found for TZ_fd.
Tonzi Z-cam data