
Field Notes
<--2012-08-30 09:00:00 | 2012-09-13 08:30:00-->Other sites visited today: Tonzi | Mayberry | Twitchell Rice | West Pond | DWR Corn
Phenocam link: Searching...
Sherman Island: 2012-09-06 08:00:00 (DOY 250)
Author: Joe Verfaillie
Others: Cove
Summary: Tried to calibrate LGR, removed SHF plate #1, pepper weed looks greener.
| Sherman
2012-09-06 I arrived about 8am PDT with Cove. I was cool and breezy with clouds to the east, but mostly clear to the west. The field still looks wet with north ditch mostly full and the middle ditch about half full. The pepper weed looks to have more green leaves and flowers than previous weeks. When we arrived the LGR read: 7:11PST, 23.12C, 127.16Torr, 13.862uSec, 10Hz, 1.884ppm We adjusted the bypass valve to bring the pressure up to 145.7Torr. We tried to calibrate the LGR but in slow flow mode the pressure dropped to about 70Torr so we did not calibrate. But in high flow mode we flowed the cal gas (1.976ppm CH4 450psi remaining) and the LGR read right on: 1.975ppm CH4. Eddy readings from the site: 16.2 mmol/m3 CO2, 630mmol/m3 H2O, 101.5kPa, 16.75C, 248 diag. We pulled SHF plate #1 (sn 001604 62.3uV/(W/m2)) for calibration. This plate has been reading strangely the last few weeks. It was right near the surface and might have been getting some direct sun through the pepper weed. Jaclyn and Laurie were there later to do the standard fieldwork. |
1 photos found
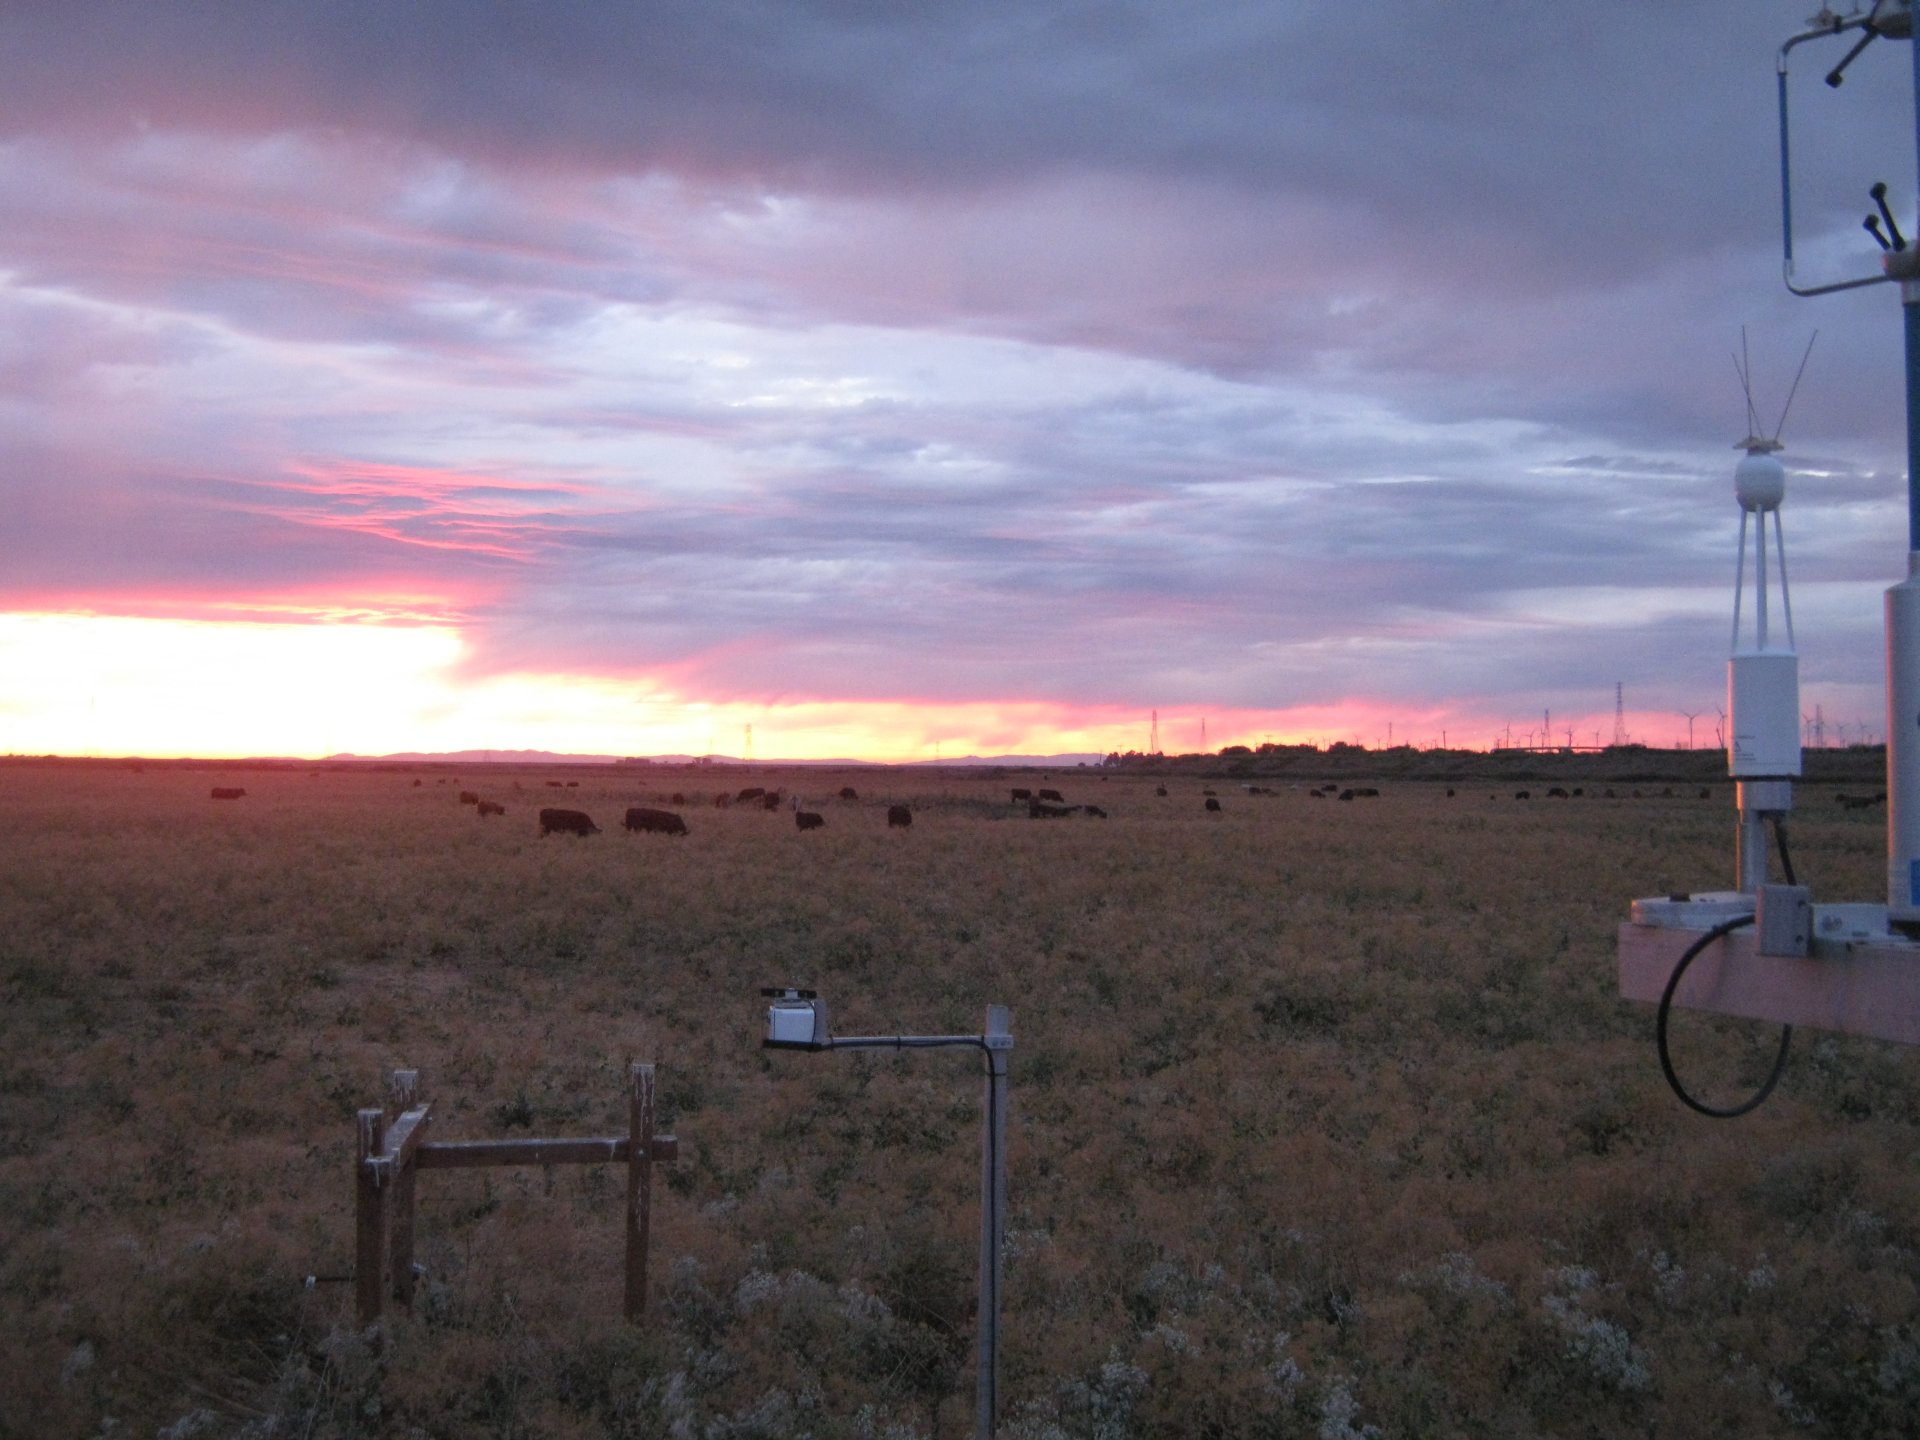
SI_autocam_20120905_1845.jpg ( 2012-09-05 18:45:03 ) Full size: 1920x1440
Nice sunset
7 sets found
No data found for SI_mp.
11 SI_met graphs found
Can't check SI_mixed
2 SI_mixed graphs found
4 SI_flx graphs found
3 SI_soilco2 graphs found
Can't check TWSI_mixed
Can't check SIMBTWEE_met