Field Notes
<--2025-03-27 12:40:00 |Other sites visited today: Tonzi
Phenocam link: Searching...
Vaira: 2025-04-10 14:30:00 (DOY 100)
Author: Joe Verfaillie
Others: Kuno, Mihkel
Summary: Trees fully leafed out, some road work done - maybe, standard data collection. All seems well.
| Vaira 2025-04-10 Kuno, Mihkel and I arrived at about 15:30 PDT. It was warm and sunny with some wispy clouds. Everything is very green. It looks like there has been some heavy traffic on the road and maybe they tried to smooth out some of the deepest holes but not an overall improvement. The water hole was full but no puddles on the road - it rained last week. There is a scattering of flowers. Kuno measured the well, but we confused the numbers a bit when I wrote it down. Mihkel and I did the regular tower work collecting the flux, met, FD and camera data. All seemed well. The 7500 read: 420.5ppm CO2, 593.6mmol/m3 H2O, 27.8C, 100.2kPa, 98.3SS I forgot to bring the Jaz again - leaving it plugged in and charging makes it hard to remember to grab. We left at about 16:00 PDT |
Field Data
No tank data
Well Depth
| Date | Location | Depth (feet) |
|---|---|---|
| 2025-04-10 | TZ_floor | 22.6 |
| 2025-04-10 | TZ_road | 30.65 |
| 2025-04-10 | TZ_tower | 25.9 |
| 2025-04-10 | VR_well | 52.4 |
No TZ Moisture Point data found
No VR Moisture Point data found
No TZ grass heigth found
No VR grass heigth found
No VR Tree DBH found
No water potential data found
No VR Grass Biomass data found
No VR OakLeaves Biomass data found
No VR PineNeedles Biomass data found
1 photos found

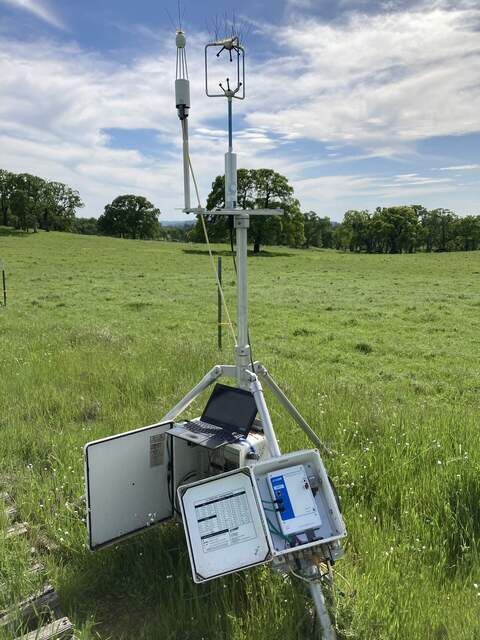
20250410VR_FluxTower.jpg ( 2025-04-10 15:41:07 ) Full size: 1440x1920
View of the eddy tower, green grass and trees
9 sets found
16 VR_met graphs found
2 VR_flux graphs found
No data found for VR_soilco2.
2 VR_pond graphs found
Can't check TZVR_mixed
3 VR_fd graphs found
No data found for VR_processed.
4 VR_arable graphs found
6 VR_soilvue graphs found

