
Field Notes
<--2012-09-05 05:30:00 | 2012-09-19 05:15:00-->Other sites visited today: Sherman Island | Mayberry | Twitchell Rice | West Pond | DWR Corn
Phenocam link: Searching...
Tonzi: 2012-09-06 05:30:00 (DOY 250)
Author: Joe Verfaillie
Others: Siyan
Summary: Predawn water potential, replced CO2 profile pump and removed IRGA, Removed one SHF plate for calibration, serviced z-cams, fixed power of floor met. Removed above ground components from C1 sap flow station.
| Tonzi
2012-09-05 I arrived about 5:30am PDT with Siyan. On the way up in the dark there were flashes of lightening visible to the south. It was mostly cloudy overhead and very dark with some thunder to the east, but to the west it was mostly clear. There were a few rain drops but not enough to get anything wet. When the sun did peek through the clouds it was hot and humid. The trees have begun to loose there leaves with many leave already on the ground. I installed a new tank of breathing air for the water potential measurements. It is cheap (~) but has a CGA 346 fitting. I gave Siyan a second high pressure hose with this fitting for the pressure bomb. While Siyan did the water potential measurements I swapped the pump on the CO2 Profile system. The old pump I had pressed into service had stopped again. The new pump, a Hargraves brushless, was running well. After the pre-dawn water potential readings we went to Vaira about 6:30am PDT. After returning from Vaira, I worked on a low battery problem with the floor met measurements. The battery powering the soil moisture, soil temperatures, SHF, floor pressure, temperature and RH was dying at night. There was already a power strip in the soil moisture box with 12VDC power from the main tower solar system. This power strip was only powering the fan for the HMP45. I removed the dead battery and solar panel for replacement and repair in the lab and powered the data loggers for the tower backed power strip. Siyan discovered that the CO2 Profile LI-810 was out of range – railed at 1000ppm. I tried to recalibrate it but had no luck in the field so I removed it. I unplugged the power to the CR10x and the pump. I serviced the z-cams. I removed SHF plate #2 (sn 000139 59.3 uV/(W/m2)) for calibration and put in a jumper to zero the channel. The insulation on this SHF plate cable is all cracked and rotting away. The plate was about 2 to 4 cm below the soil surface. The tram was running. The tower top sensors looked clean and operational. I checked the OSU sites and they looked fine. I removed the above ground components of the C1 sap low station. I removed two metal bands from dead pine trees to the south of the tower. Tree numbers 12174 and 12173. |
Field Data
No tank data
No TZ Well data found
No TZ Moisture Point data found
No VR Moisture Point data found
No TZ grass heigth found
No VR grass heigth found
No TZ Tree DBH found
No water potential data found
No TZ Grass Biomass data found
No TZ OakLeaves Biomass data found
No TZ PineNeedles Biomass data found
5 photos found
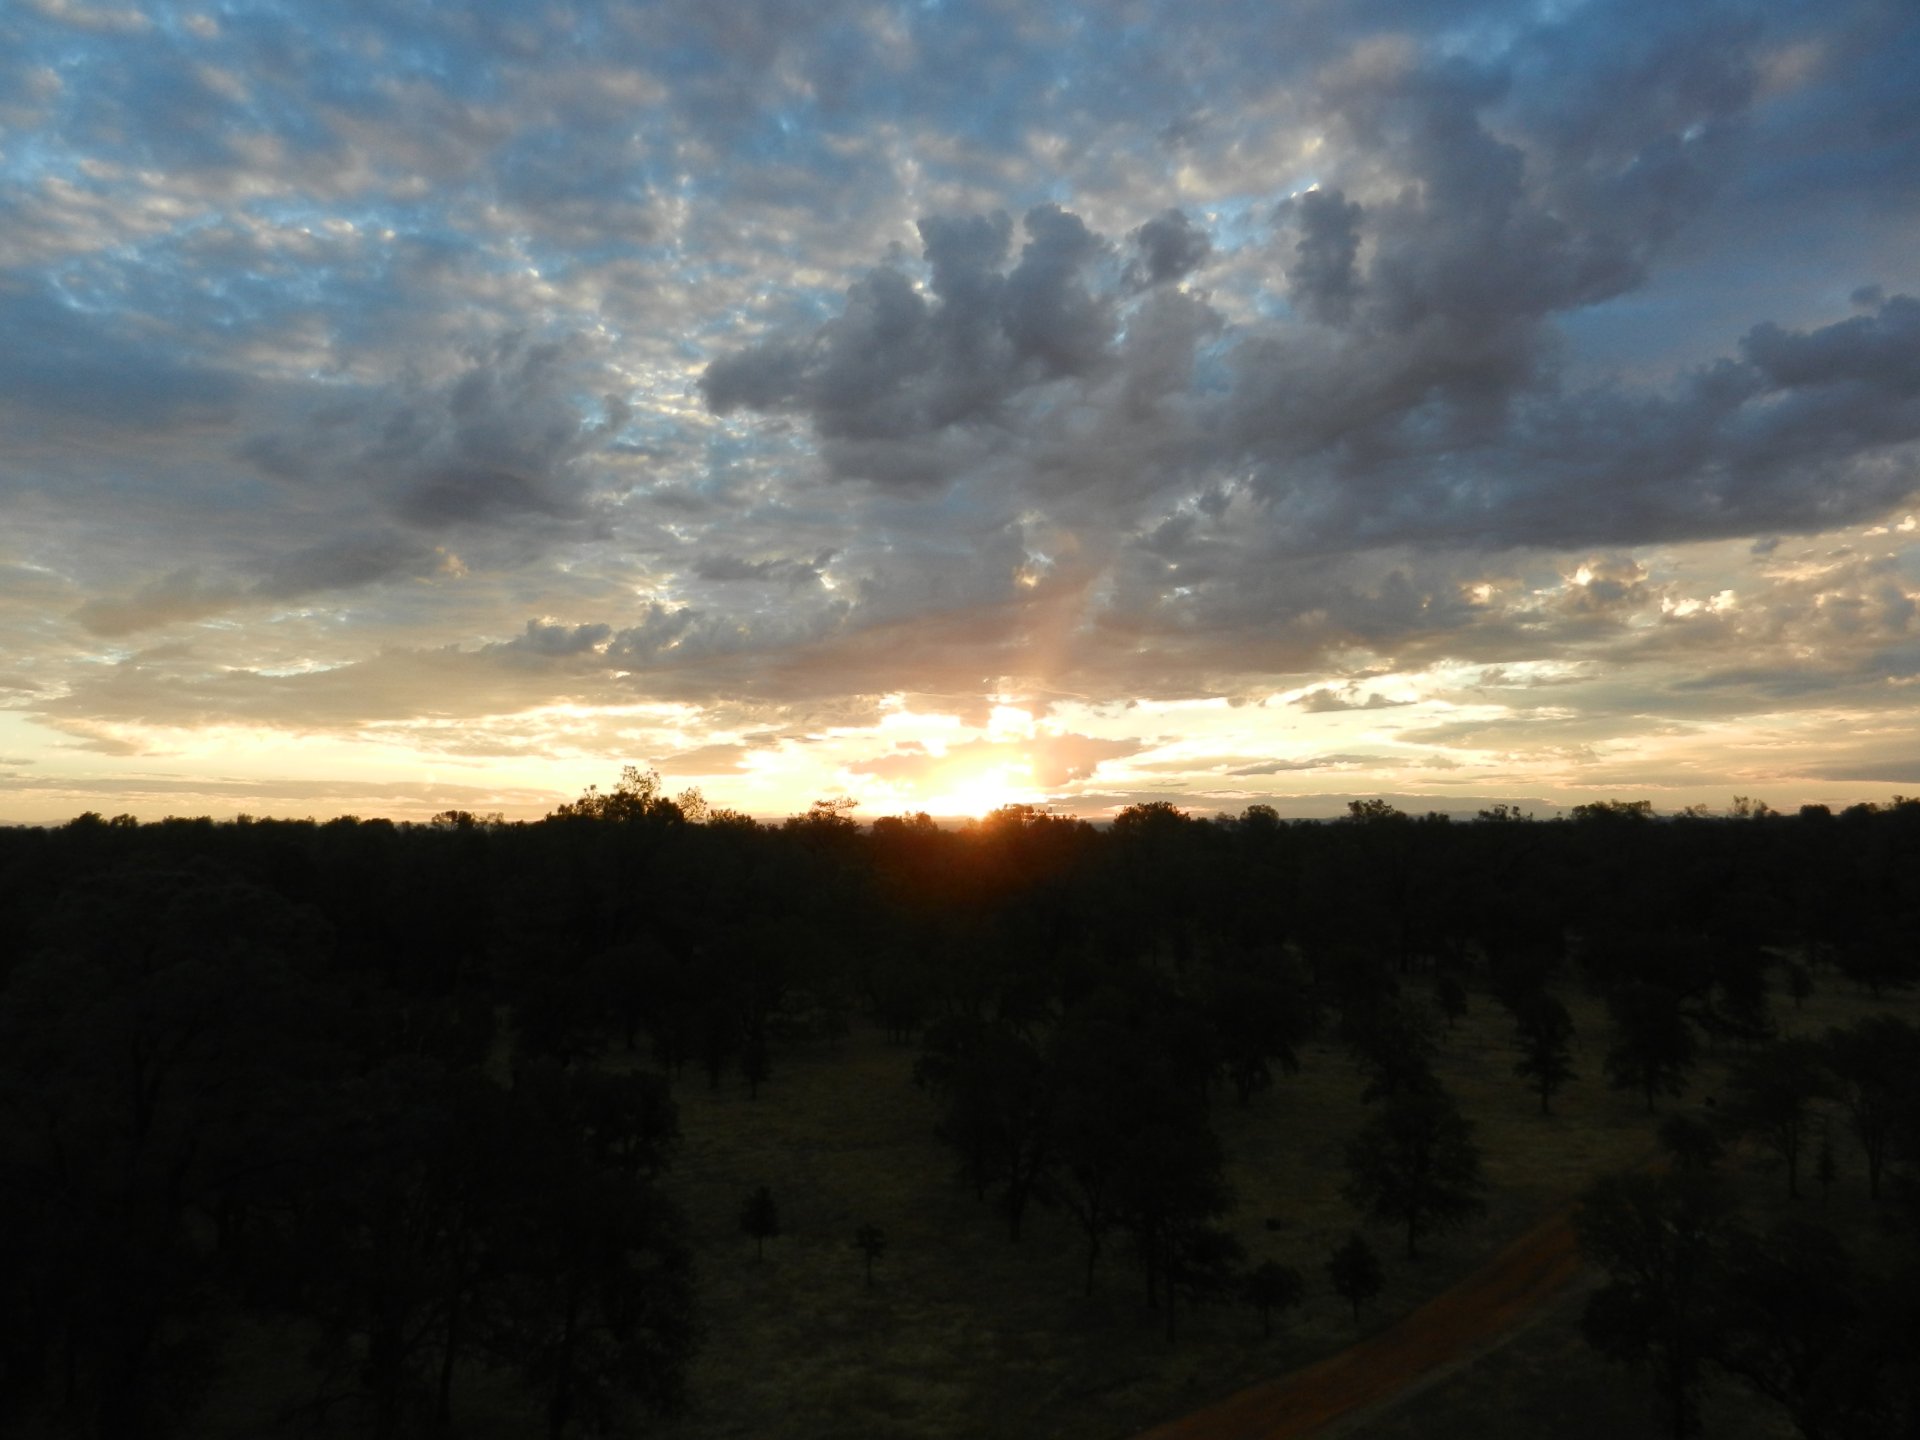
20120905TZ_Dawn.jpg ( 2012-09-05 06:49:44 ) Full size: 1920x1440
Nice sunset over the oak woodland
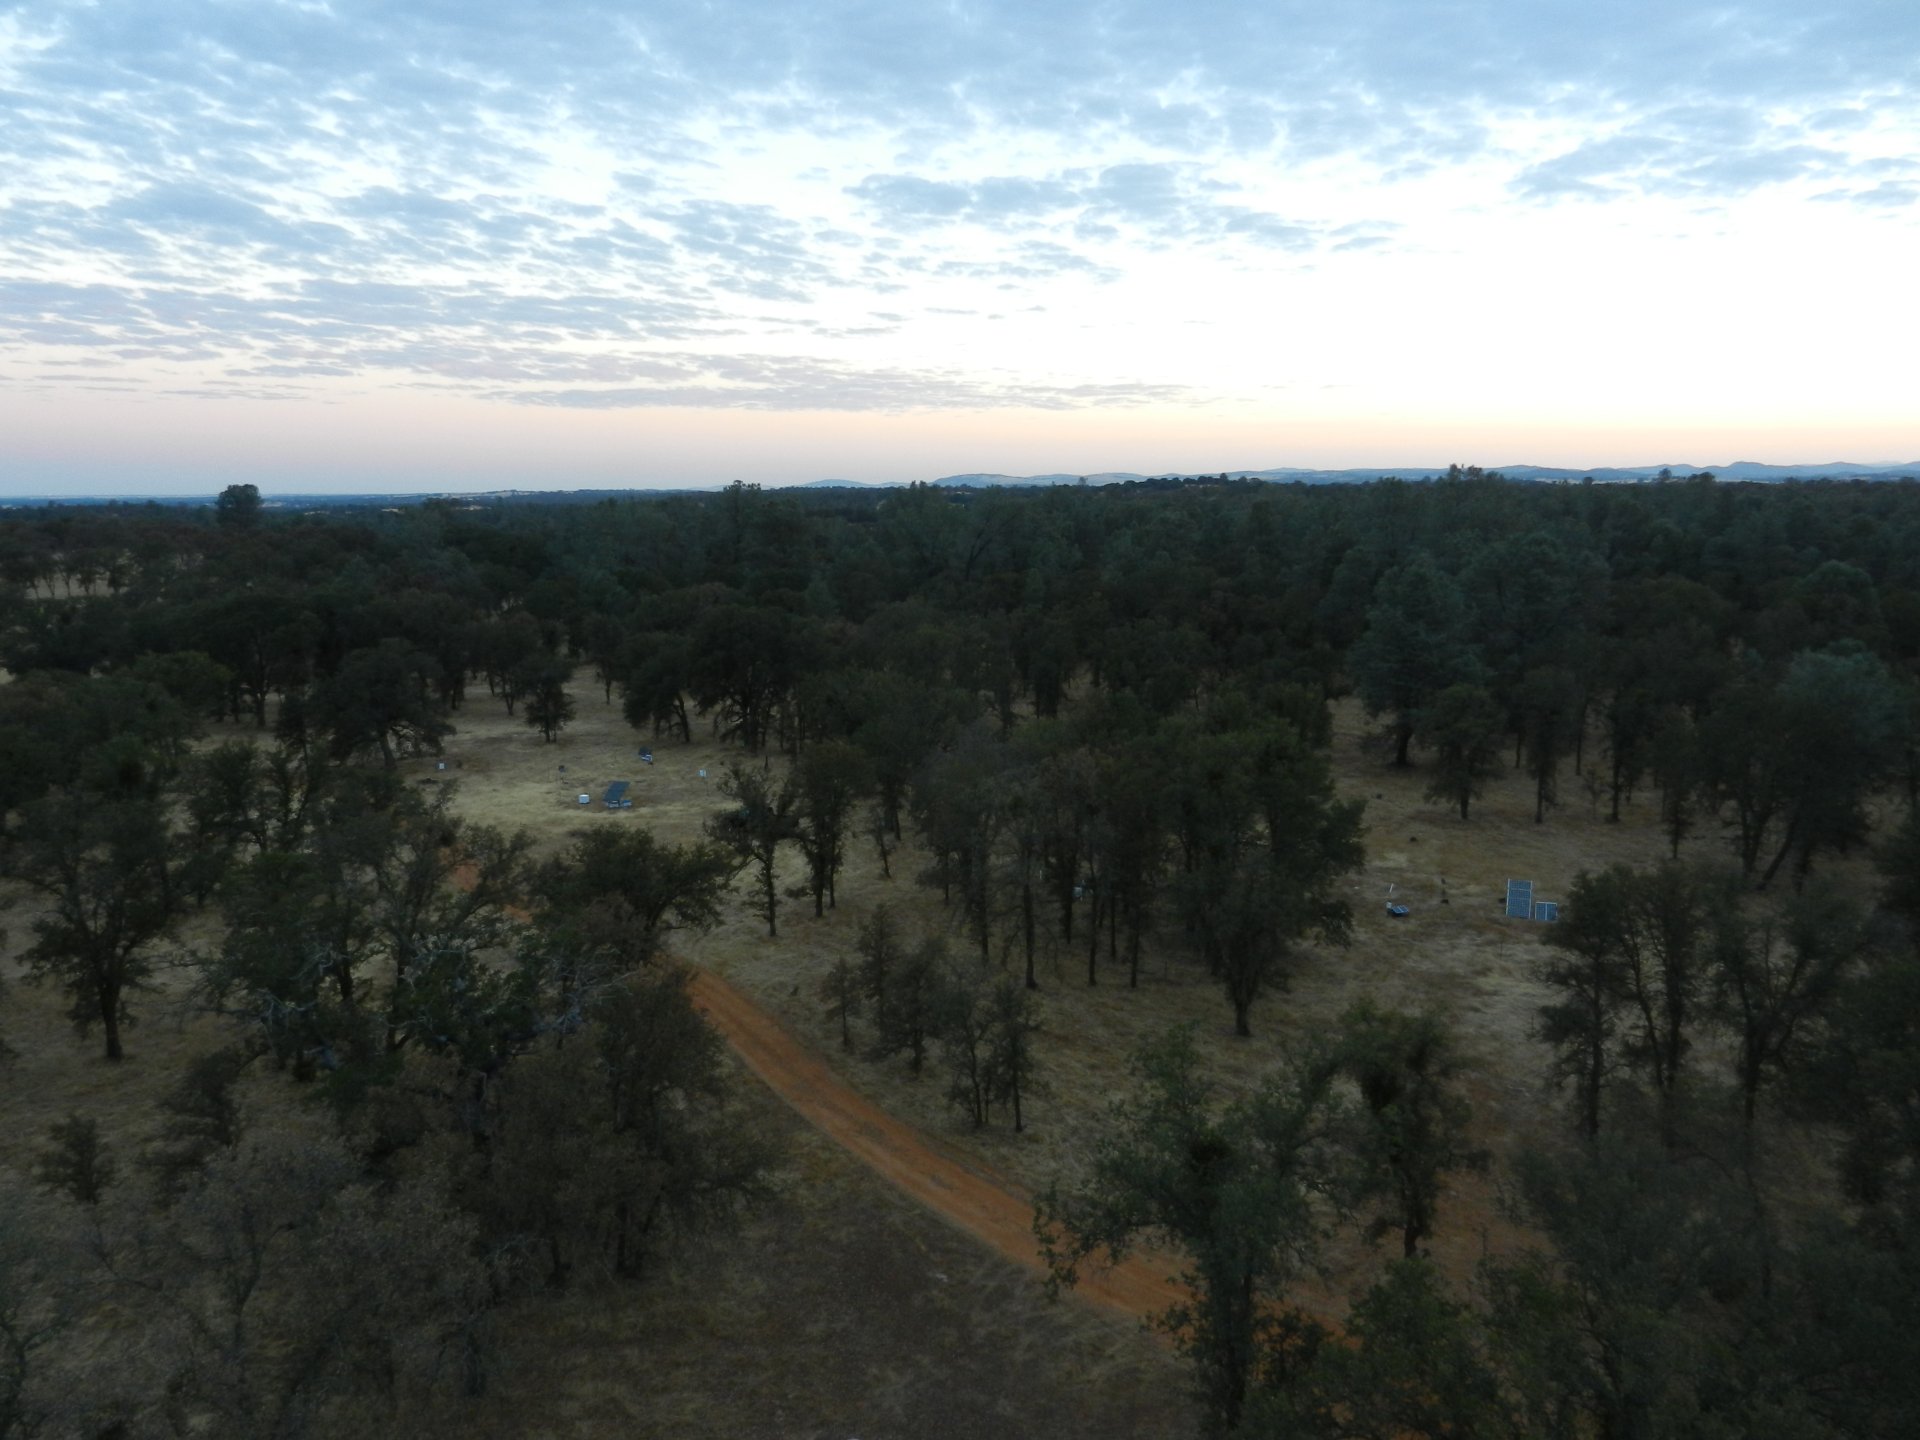
20120905TZ_PredawnSite.jpg ( 2012-09-05 06:37:45 ) Full size: 1920x1440
Predawn view of the oak woodland from the tower top
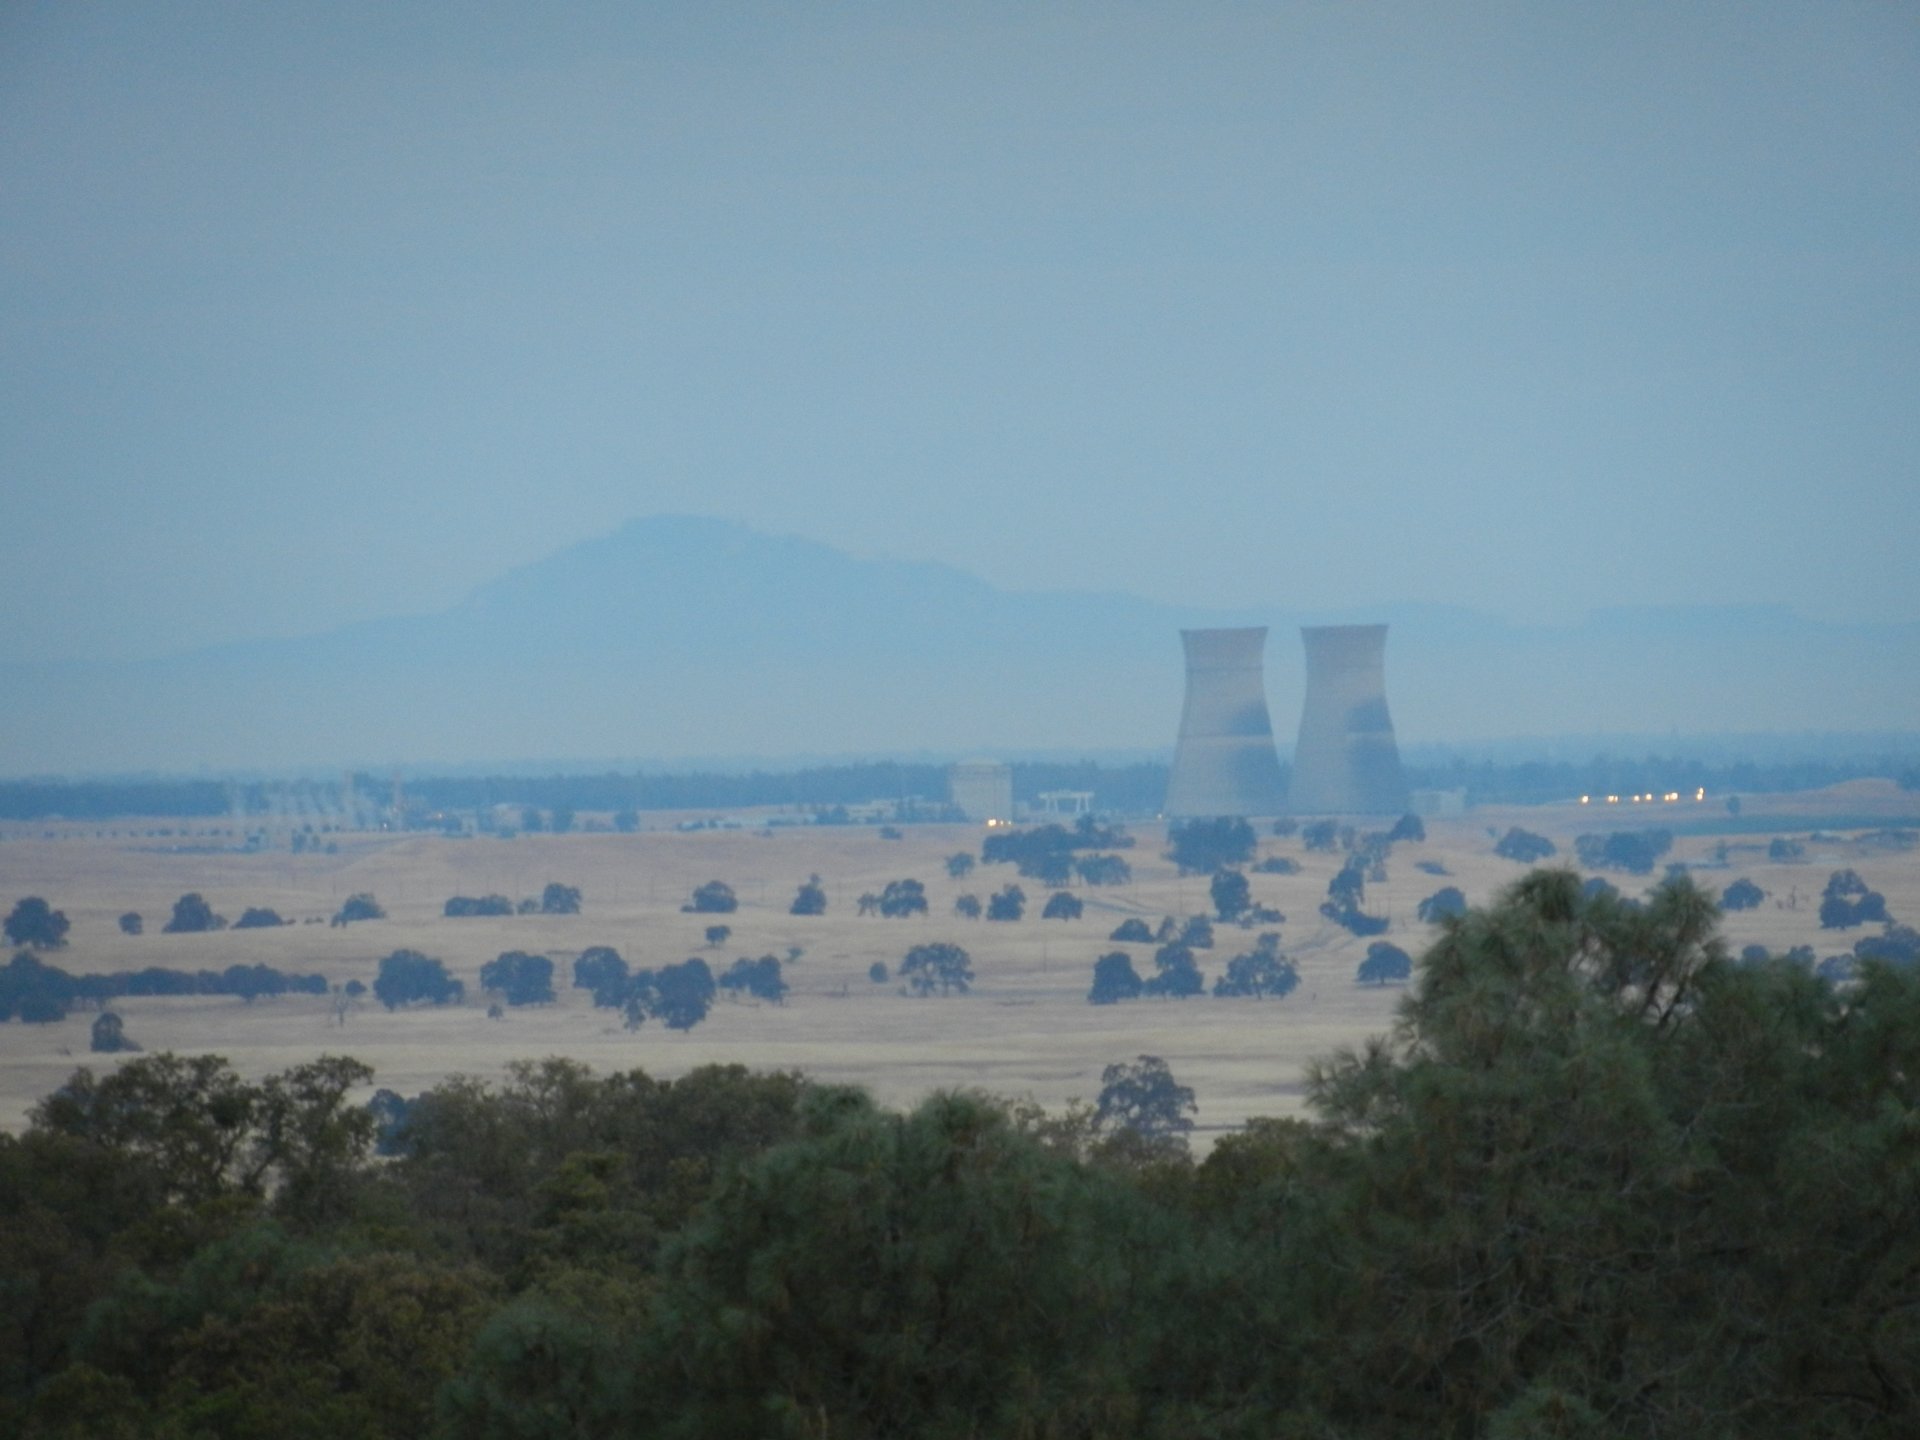
20120905TZ_RanchoSecoDiablo.jpg ( 2012-09-05 06:38:14 ) Full size: 1920x1440
View of Mt Diablo and Rancho Seco from Tonzi Tower
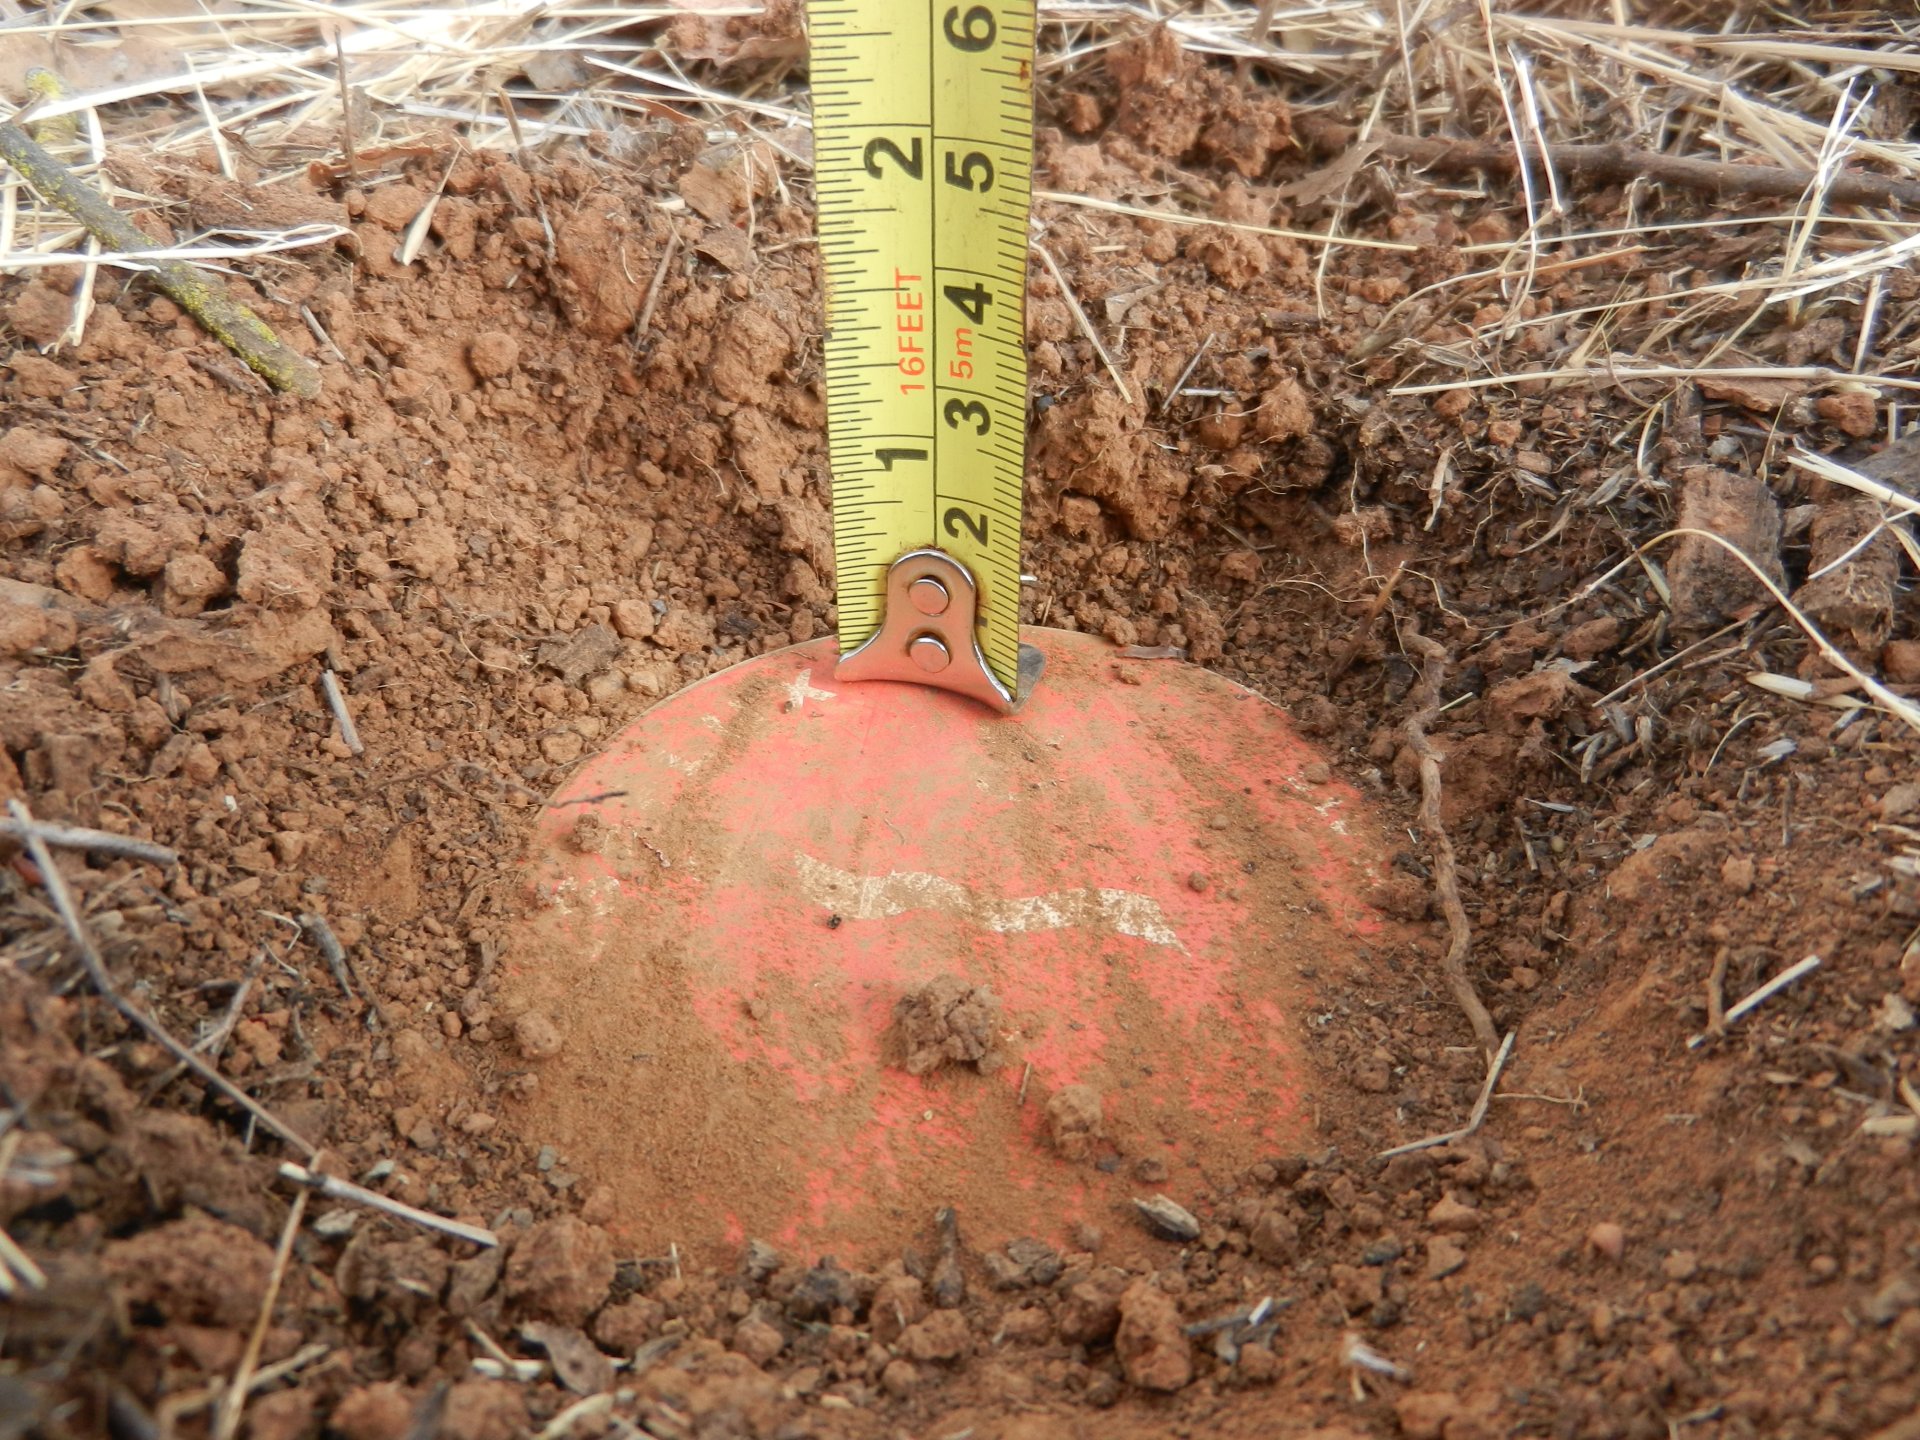
20120905TZ_SHFPlateDepth.jpg ( 2012-09-05 10:04:36 ) Full size: 1920x1440
Depth to recovered soil heat flux plate
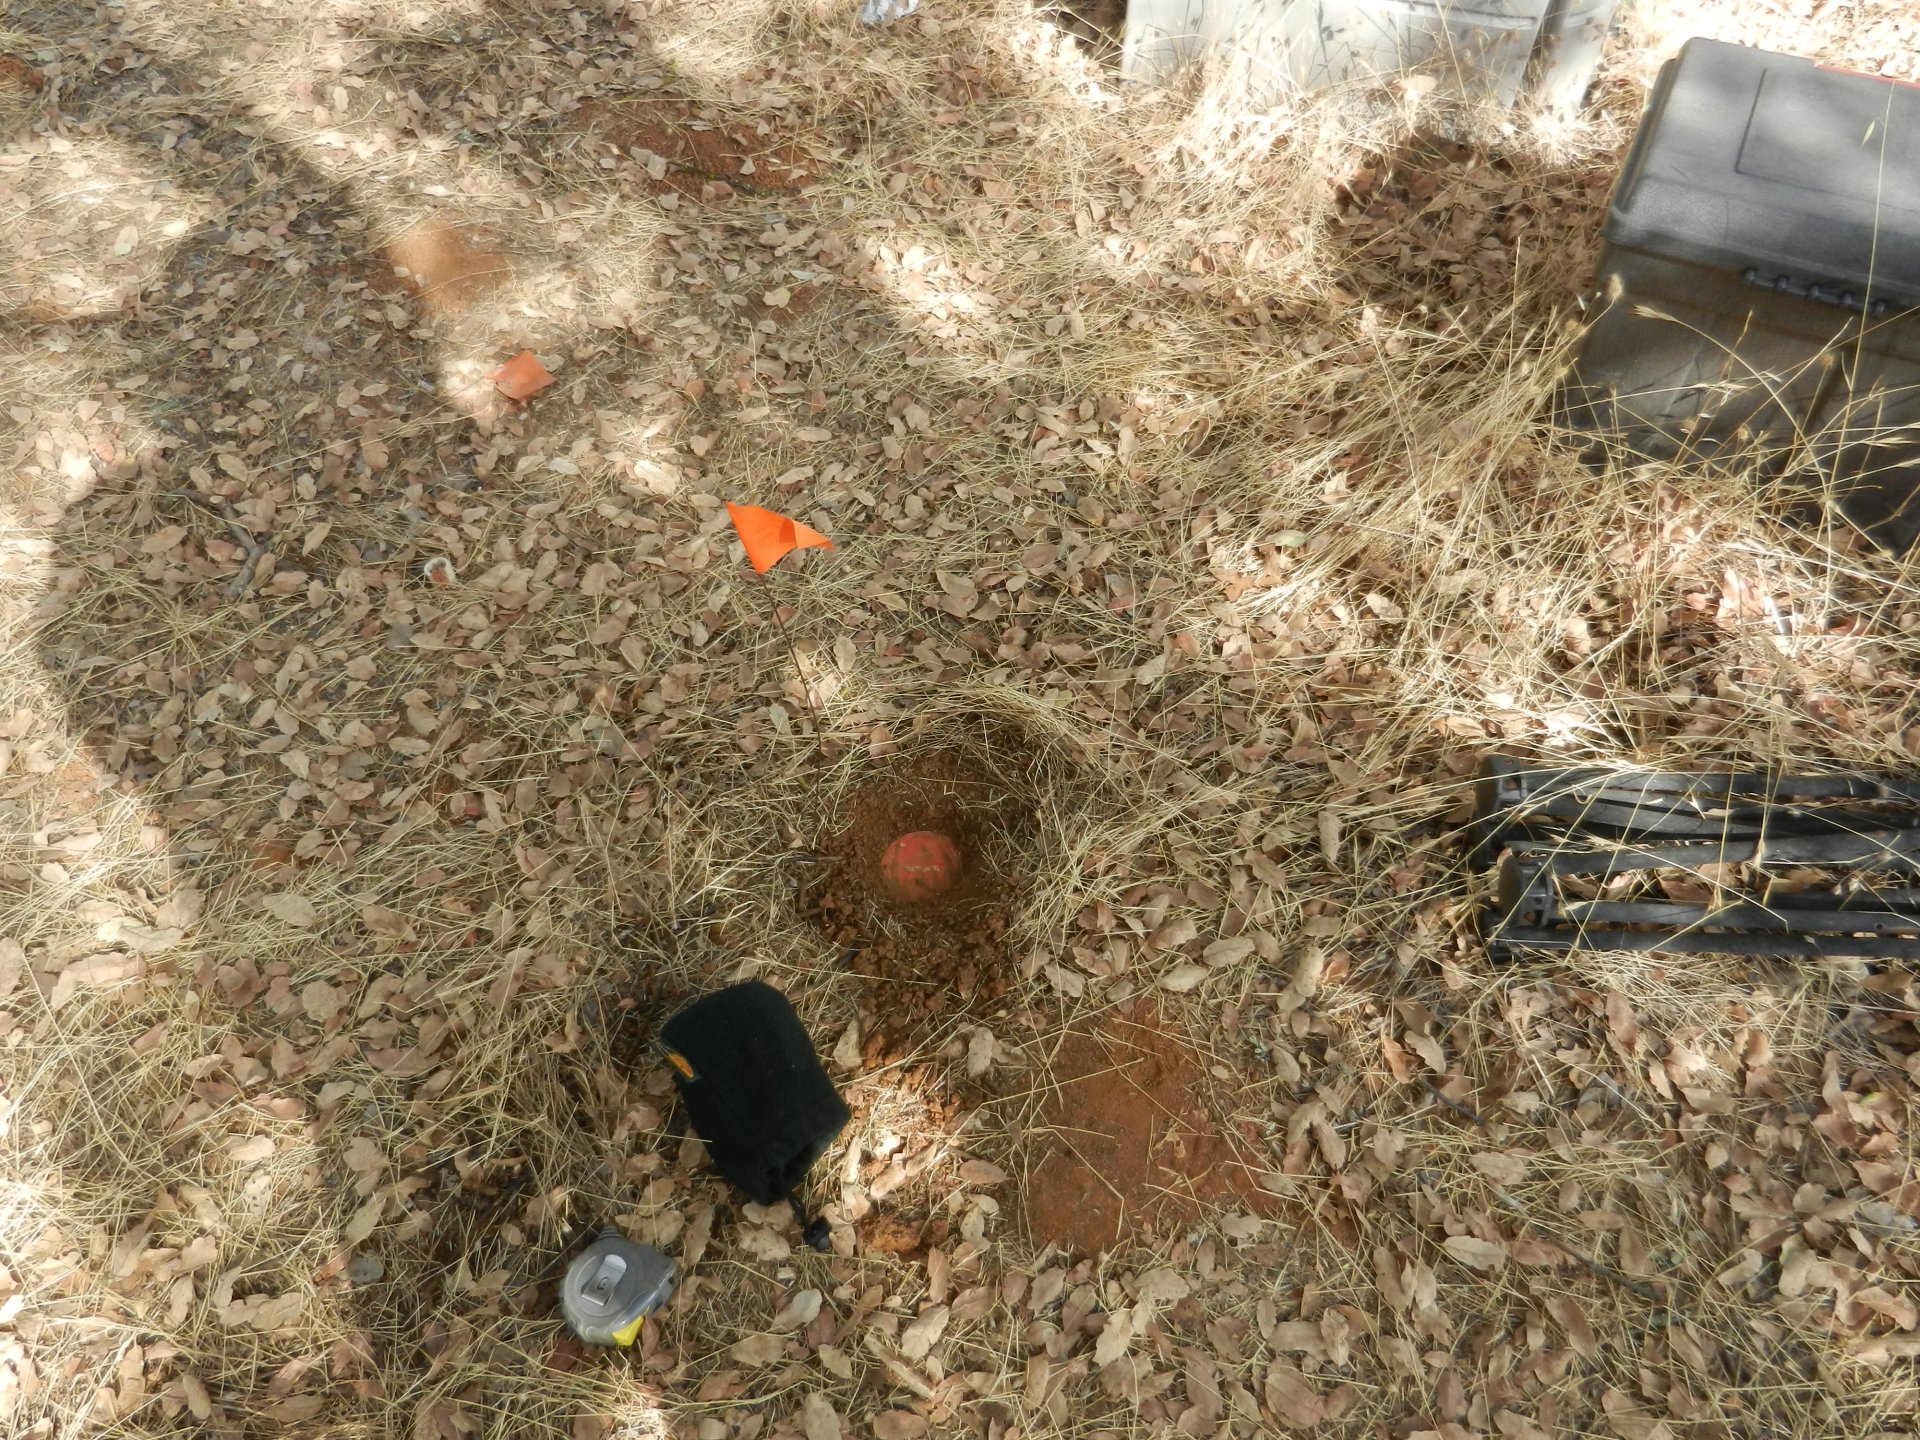
20120905TZ_SHFPlatePosition.jpg ( 2012-09-05 10:05:10 ) Full size: 1920x1440
Location of a soil heat flux plate
16 sets found
No data found for TZ_Fenergy.
11 TZ_tmet graphs found
11 TZ_soilco2 graphs found
Can't check TZ_mixed
3 TZ_mixed graphs found
1 TZ_fflux graphs found
8 TZ_fmet graphs found
1 TZ_tram graphs found
3 TZ_co2prof graphs found
No data found for TZ_irt.
No data found for TZ_windprof.
1 TZ_tflux graphs found
2 TZ_sm graphs found
Can't check TZ_met
1 TZ_met graphs found
Can't check TZVR_mixed
8 TZ_osu graphs found
No data found for TZ_fd.
Tonzi Z-cam data