
Field Notes
<--2025-03-27 08:00:00 | 2025-04-17 10:00:00-->Other sites visited today: Vaira
Phenocam link: Searching...
Tonzi: 2025-04-10 10:00:00 (DOY 100)
Author: Joe Verfaillie
Others: Kuno, Mihkel, Housen
Summary: Housen collect first batch of GPS data, Kuno doing standard chamber fluxes, Mihkel visiting the site, removed Theta 7, nearly fully leafed out.
| Tonzi 2025-04-10 Kuno, Mihkel and I arrived at about 11:00 PDT. Mihkel is Kuno's technician visiting for the week. Housen was already at the site having arrived a little before us. It was a beautiful sunny day with wispy clouds and very little breeze. The trees are close to fully leafed out and look in better health than last year. There was some rain last week that I was worried would cause damage (fungus) to the new leaves again but seems not. The grass is also super green with flowers starting. Overall probably the best week of the year. On the way through the Delta we notice some of the hill sides already turning brown. I showed Mihkel around while Kuno started his usual chamber work. The trees are still emitting CH4 and the ground is taking up a little less than last time. From the top of the tower we could see Mount Diablo. I collected the Tower top data: flux and camera data. The wash reservoir was about a quarter low - refilled. I cleaned the radiometers. The 7500 read: 437.7ppm CO2, 552.6mmol/m3 H2O, 23.2C, 99.7kPa, 99.7SS The 7700 read: 2.04ppm CH4, 58.2RSSI - 86.2 after cleaning On the ground we did the manual soil moisture readings, manual well levels, serviced the zcams, collected the FD data and read the dendrometers. I collected the Floor data: well, flux and camera data. The wash reservoir was about a quarter low - refilled. The 7500 read: 434.4ppm CO2, 565.2mmol/m3 H2O, 23.0C, 99.8kPa, 102.8SS The 7700 read: 1.99ppm CH4, 48.4RSSI - 75.4 after cleaning Housen downloaded data from the GPS units he set up last time. There was about 2GB on each of the three units. He said the antenna cable had come loose from the unit on the tower top. He also showed me how to connect to the units over wifi and download the data. Housen will send me a written protocol too. I tried running the $40 GPS I got from Amazon. It was only seeing about 12 satellites when Housen's units were seeing about 30. I need to play with this more in the lab. Towards the end Mihkel and Kuno carried the chamber stuff to the pond to do water flux and quality measurements - the pH was high 8+ and the CH4 fluxes were low. I finished up by collecting the point dendrometer data. The tree HISE 3 is attached to has died. I think I will leave it here to compare with the living trees. I also pulled Theta probe 7 sn xxx that has been reading about half of the other Theta probes. We left at about 15:15 PDT |
Field Data
No tank data
Well Depth
| Date | Location | Depth (feet) |
|---|---|---|
| 2025-04-10 | TZ_floor | 22.6 |
| 2025-04-10 | TZ_road | 30.65 |
| 2025-04-10 | TZ_tower | 25.9 |
| 2025-04-10 | VR_well | 52.4 |
No TZ Moisture Point data found
No VR Moisture Point data found
No TZ grass heigth found
No VR grass heigth found
Tree DBH
| Date | Tag# | Reading (mm) |
|---|---|---|
| 2025-04-10 | 102 | 8.4 |
| 2025-04-10 | 2 | 18.2 |
| 2025-04-10 | 245 | 13.6 |
| 2025-04-10 | 3 | 11.7 |
| 2025-04-10 | 4 | 15.1 |
| 2025-04-10 | 5 | 7.7 |
| 2025-04-10 | 6 | 10.4 |
| 2025-04-10 | 7 | 17.8 |
| 2025-04-10 | 72 | 5.6 |
| 2025-04-10 | 79 | 12.0 |
Water Potential - mode: raw
| Time | Species | Tree | readings (bar) | ||
|---|---|---|---|---|---|
| 2025-04-10 13:40:00 | OAK | 102 | -25 | -11 | -10 |
| 2025-04-10 13:40:00 | OAK | 92 | -15 | -18 | -19 |
No TZ Grass Biomass data found
No TZ OakLeaves Biomass data found
No TZ PineNeedles Biomass data found
1 photos found
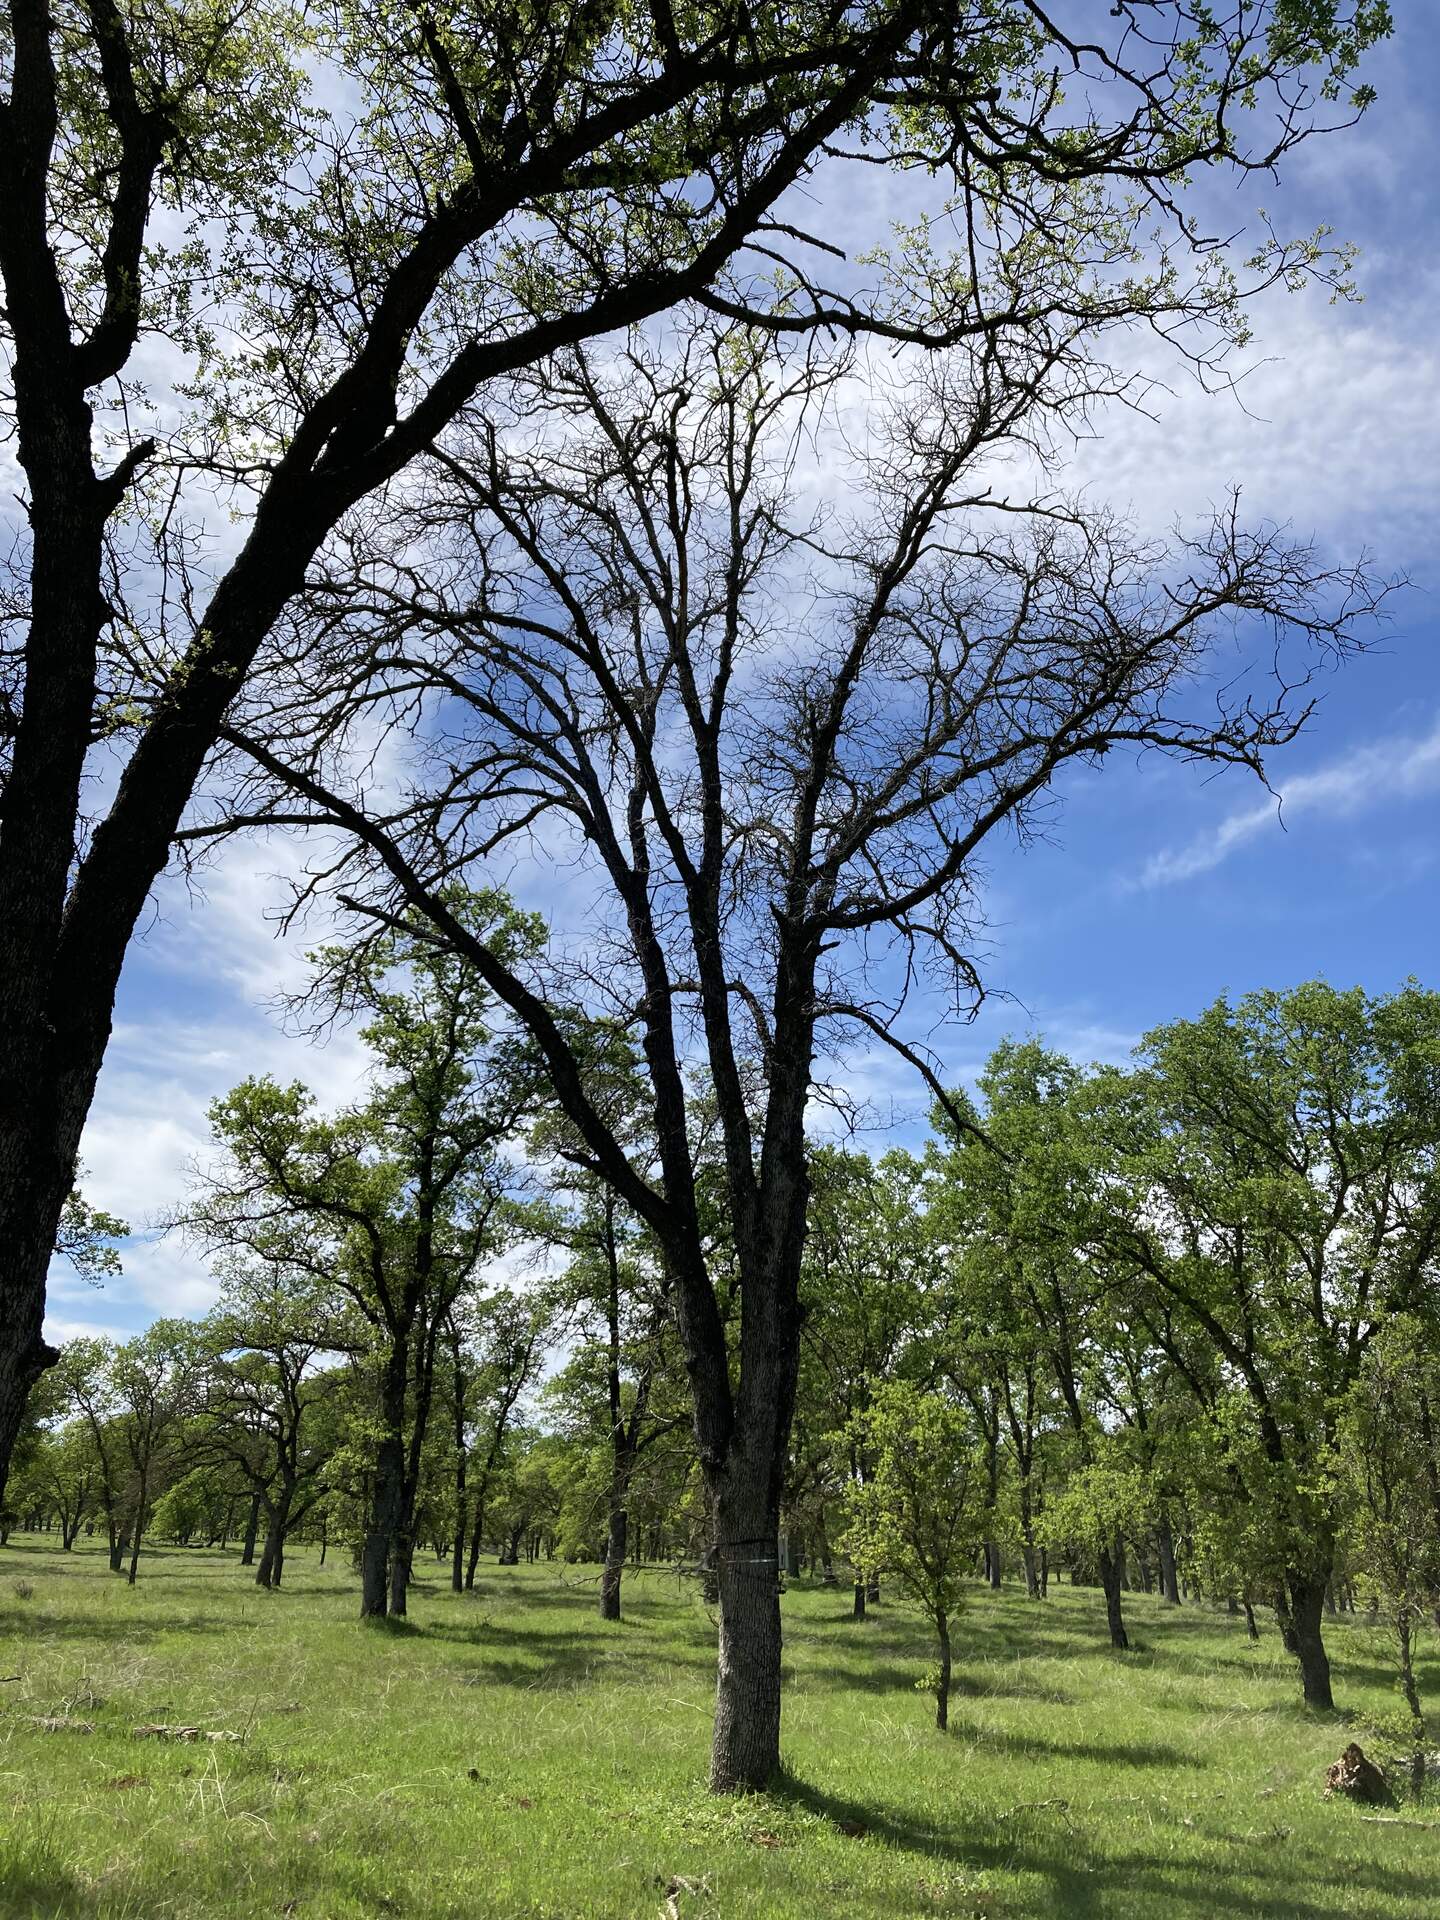
20250410TZ_DeadTree.jpg ( 2025-04-10 14:44:38 ) Full size: 1440x1920
Dead tree surrounded by green grass an other trees
16 sets found
No data found for TZ_Fenergy.
11 TZ_tmet graphs found
No data found for TZ_soilco2.
Can't check TZ_mixed
3 TZ_mixed graphs found
1 TZ_fflux graphs found
8 TZ_fmet graphs found
No data found for TZ_tram.
3 TZ_co2prof graphs found
1 TZ_irt graphs found
No data found for TZ_windprof.
1 TZ_tflux graphs found
8 TZ_sm graphs found
Can't check TZ_met
1 TZ_met graphs found
Can't check TZVR_mixed
8 TZ_osu graphs found
3 TZ_fd graphs found
Tonzi Z-cam data