Field Notes
<--2012-08-30 13:00:00 | 2012-09-13 09:45:00-->Other sites visited today: Tonzi | Sherman Island | Twitchell Rice | West Pond | DWR Corn
Phenocam link: Searching...
Mayberry: 2012-09-06 09:00:00 (DOY 250)
Author: Joe Verfaillie
Others: Cove
Summary: Calibrated 7700s, removed SHF plates, removed deeper water DO sensor, broke water CO2 enclosure.
| Mayberry
2012-09-06 I arrived about 9:00am PDT with Cove. It was cool and breezy with clouds to the east dissipating. The west was mostly clear. The ground at portable tower Location Two looked a little wet in patches. The cattail seeds are beginning to turn into fluff and dispersing. There are some large cracks in the main tower berm we first noticed last week. They don’t threaten the tower yet but the edges of the berm seem to be settling. We moved the portable tower from Location Two to Location One. The truck seemed to take and extra crank to start. Maybe we should get a solar panel on the truck battery to help keep it charged. At Location One we calibrated the LI7700 (sn TG1-0155) with a tank of Ultra Zero Air (1900psi) and a tank of 4.982ppm CH4 in air (950psi). We cleaned the mirrors before calibration bringing the RSSI up from about 30 to about 72. The last calibration was at Licor on 2012-07-27. Temperature was 16.3C and Pressure was 101.4kPa. We flowed the gas at a relatively high rate to wash out the cell space quickly. There seemed no difference in concentration and very little difference in pressure between high flow rates and the low flow rates we normally use with the LI7500s. Zero was off by +0.025ppm and the span was off by 0.036ppm at 5.018ppm. After calibration the eddy system was running fine 1.916ppm CH4, 64.8RSSI, 378ppm CO2, 670mmol/m3 H2O, 37.5AGC, 343.4m/s SOS At the Main Tower Cove calibrated the LI7700 (sn TG1-0224). Last calibration was by Licor on 2012-01-19. T=17.0C, P=101.37kPa. RSSI went from 50 to 58 with cleaning. Zero was off by 0.034ppm and span was off by 0.016ppm at 4.998ppm. After calibration the eddy system read: 1.92ppm CH4, 69RSSI, 387ppm CO2, 680mmol/m3 H2O, 43.8AGC, 343m/s SOS I went out to the Tule Tower. I removed the two SHF plates, neither one seemed to have a serial number. I put jumpers in the empty channels to zero them out. The other sensors looked clean. As we were preparing to leave Jaclyn and Laurie arrive to take water samples. And we discovered that the deeper water DO sensor was reading –INF. Jaclyn removed the DO sensor but bumped the Vaisala CO2 sensor and the PVC encasement fell apart. Jaclyn removed the CO2 sensor from the water. |
3 photos found

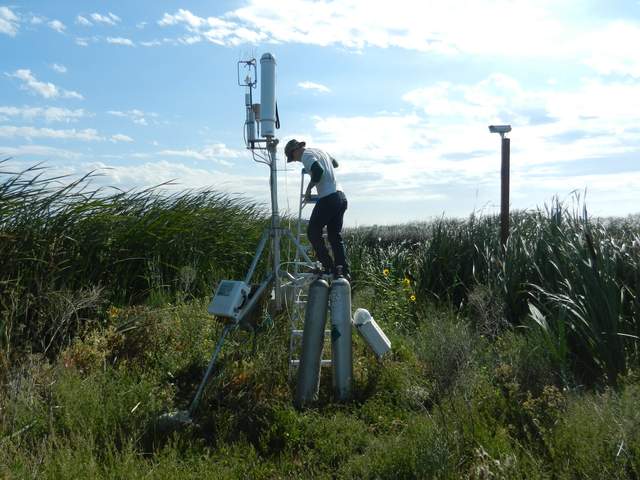
20120906MB_LI7700Cal.jpg ( 2012-09-06 09:59:14 ) Full size: 1920x1440
Cove calibrating the 7700

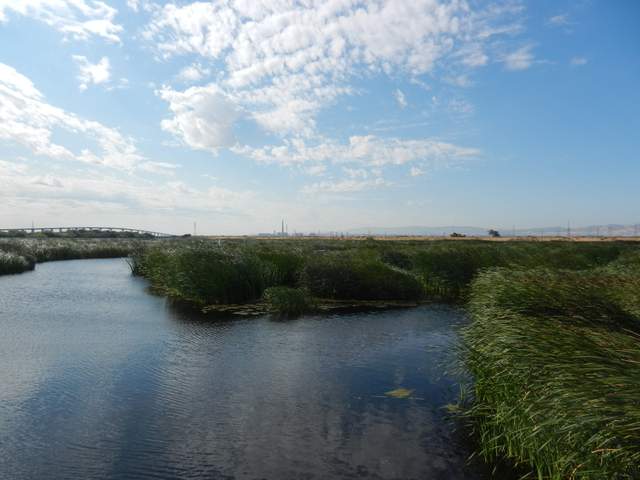
20120906MB_TowerFromTules.jpg ( 2012-09-06 10:10:50 ) Full size: 1920x1440
Green wetland on a breezy day

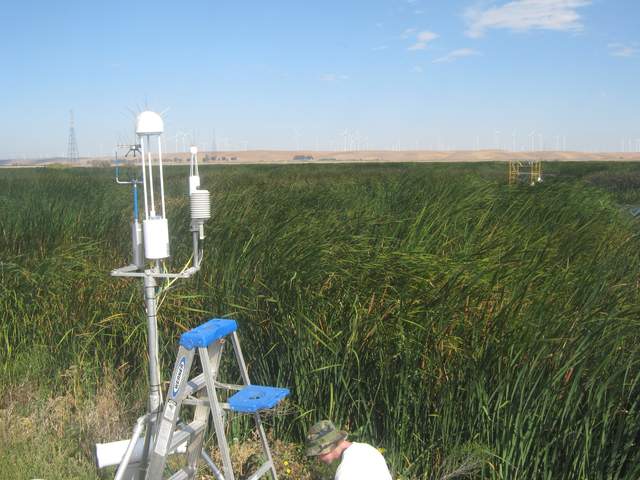
MB_autocam_20120906_1015.jpg ( 2012-09-06 10:15:02 ) Full size: 1920x1440
Cove on site
11 sets found
7 MB_flux graphs found
No data found for MB_met.
28 MB_tule graphs found
Can't check MBWPEESWGT_mixed
1 MB_cam graphs found
Can't check MBEEWPSWEPGT_cam
Can't check SIMBTWEE_met
No data found for MB_minidot.
Can't check MBSWEEWPBCBA
1 MB_processed graphs found
Can't check MB_fd
1 MB_fd graphs found

