Field Notes
<--2012-05-25 14:30:00 | 2012-06-07 14:00:00-->Other sites visited today: West Pond | Twitchell Rice | Mayberry | Sherman Island
Phenocam link: Searching...
DWR Corn: 2012-05-31 10:00:00 (DOY 152)
Author: Joe Verfaillie
Others: Sara, Carina
Summary: Moved ground sensors into the field, corn is up maybe some bald spots near the tower, fixed some wiring, did some field measurments.
| DWR Corn
2012-05-31 I arrived about 10:00PDT with Sara and Carina. It was clear, sunny and hot with a very light breeze. The corn has sprouted and is about 5cm tall. The corn of the east side of the tower starts about 1.5 m from the base of the tower. On the west side the corn starts about 3m from the tower and is a little beat up by our work there before it sprouted. Also on the west side there’s one strip near the tower maybe 7m wide that seems to be coming up nicely, but the next 7m strip seems bare like the planter ran out of seed. Further out the corn sprouts seem uniform. We moved the ground sensor from the side of the field into the field proper west of the tower. I broke two of the soil temperature profile sticks, but was able to redrill them and get them inserted properly. The sticks get very soft after being in damp soil for a while. The well on the side of the field had water in it at 54cm below the ground level. The pressure probe was 94cm below the ground surface. In the new well in the field the probe is 103cm below the ground level and is between rows of corn. One of the Theta probes was not connected to power. I fixed this, but a new, larger and better positioned power strip would be nice. The first SHF plate was wired backwards. I fixed this too. The data logger was one hour ahead. I reset the data loggers time to 10:41:00 when the data logger read 11:40:48. The solar power read 13.7V, 3.0A solar, 0.5A load. I checked the level of the sonic due to high vertical wind speeds in the data. The sonic was about a level as it can be. Maybe air flow off the solar panels? I tightened the bolts on the solar panels. I mounted the tipping bucket on the top, northwest corner of the scaffolding. Things will move as we get better mounts set up. Sara and Carina took soil samples and spectrum readings. |
6 photos found
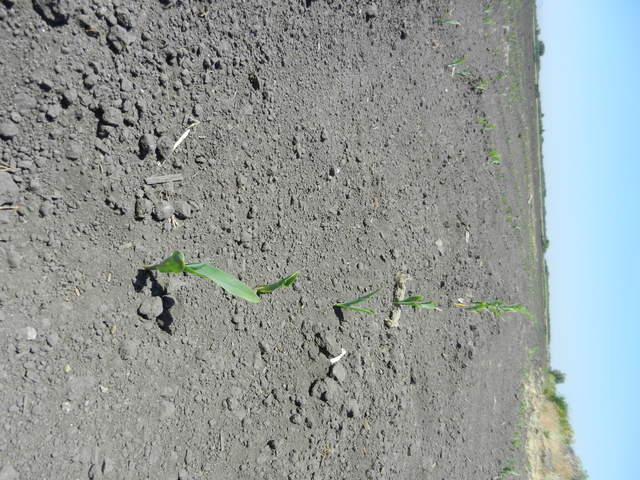
20120531DC_Corn.jpg ( 2012-05-31 12:14:09 ) Full size: 4000x3000
Corn sprouts in a row
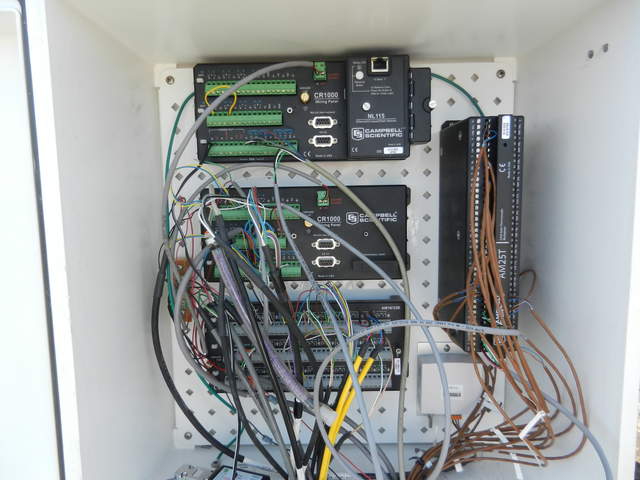
20120531DC_DataloggerBox.jpg ( 2012-05-31 12:00:37 ) Full size: 4000x3000
Wiring inside the data logger box at Twitchell Corn
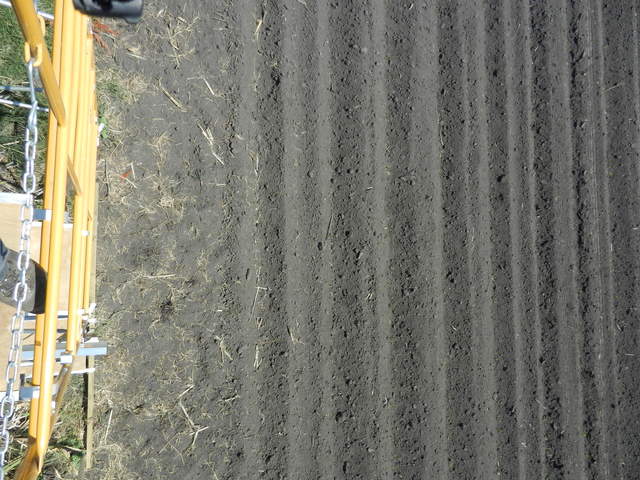
20120531DC_EastSideOfTower.jpg ( 2012-05-31 11:43:55 ) Full size: 4000x3000
View down from top of scaffolding of row furrows
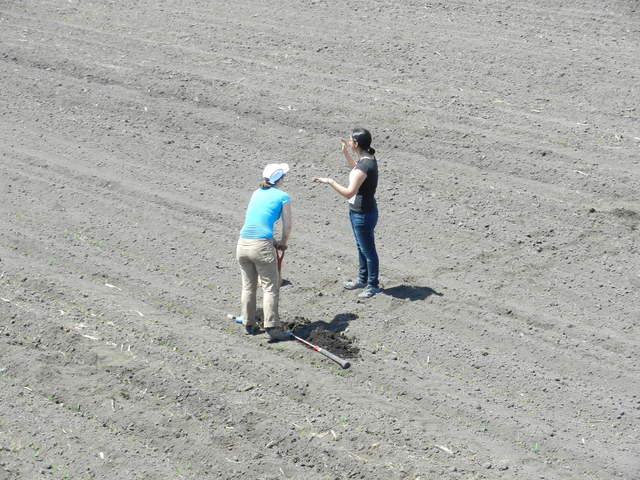
20120531DC_SaraCarina.jpg ( 2012-05-31 11:43:35 ) Full size: 4000x3000
Sara and Carina taking soil samples
20120531DC_TowerTopField.jpg ( 2012-05-31 11:43:26 ) Full size: 4000x3000
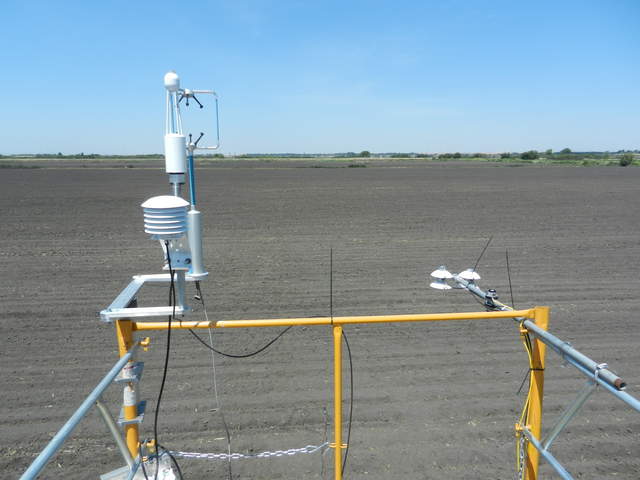
View of the freshly planted corn field with eddy and radiation sensors
20120531DC_WestSideOfTower.jpg ( 2012-05-31 11:44:07 ) Full size: 4000x3000
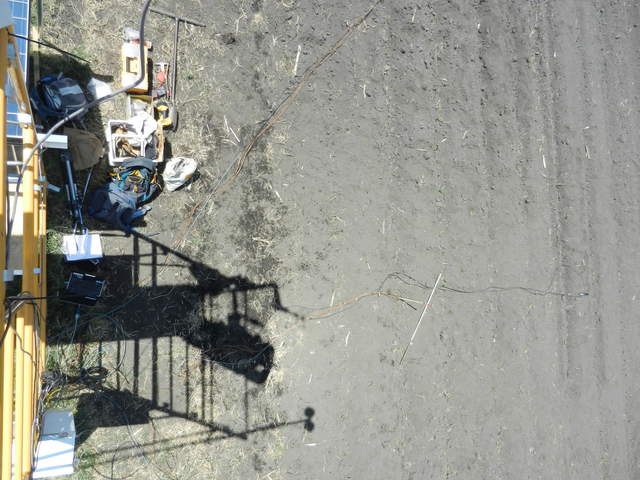
View down from top of scaffolding of row furrows disturbed by sensor installation work
3 sets found
Can't check DC_mixed
3 DC_mixed graphs found
7 DC_met graphs found
3 DC_flux graphs found

