Field Notes
<--2012-04-17 09:30:00 | 2012-05-02 09:00:00-->Other sites visited today: West Pond | Twitchell Rice | Mayberry
Phenocam link: Searching...
Sherman Island: 2012-04-24 09:30:00 (DOY 115)
Author: Joe Verfaillie
Others: Jaclyn, Sara
Summary: Tried to install power relay for Vaisala, but failed. Fixed exisiting soil CO2 program.
| Sherman
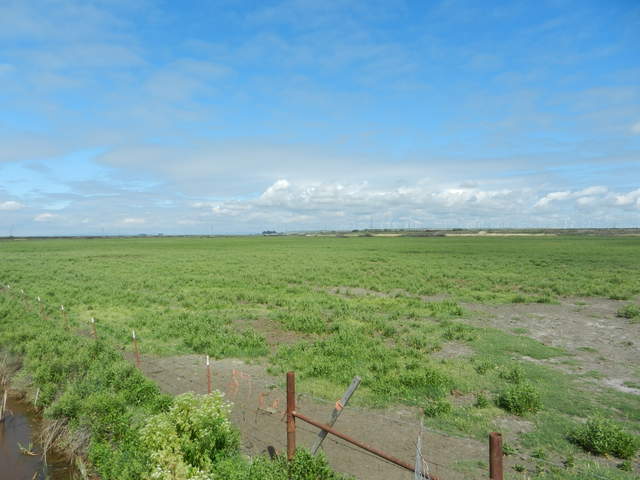
2012-04-24 I arrived about 9:30PDT with Jaclyn and Sara. It was warm and sunny with little to no wind making it feel hot. The weeds are growing like weeds. Outside the cow fence the pepper weed is about knee high and inside the fence it is about waist high. The grass has fox tails and the pepper weed has buds. Sara and I tried to add a relay to turn one set of three Vaisala probes on and off. However, everything the data logger energized the relay, the logger restarted. At first I thought the relay was pulling too much power from the control port, but even on the switched 12V port the data logger restarted. A volt meter said that the relay was pulling about 30mA. We put everything back and brought the relay in for testing in the lab. I fixed the program so that the averages of the reference soil temperatures are now recorded. Jaclyn did spectral measurements. The LI7700 RSSI was about 33. After cleaning the mirrors it was 69. The reservoir didn’t need any water. |
5 photos found

20120424SI_Field.jpg ( 2012-04-24 10:30:20 ) Full size: 4000x3000
Cow pasture with green grass and pepper weed

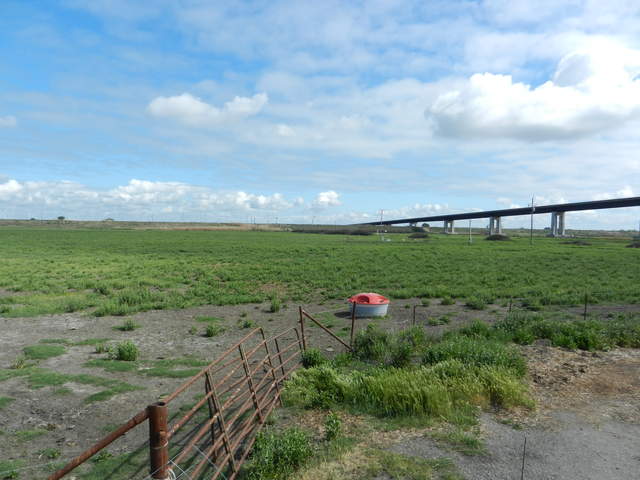
20120424SI_Site.jpg ( 2012-04-24 10:30:14 ) Full size: 4000x3000
View of green cow pasture and bridge

SI_autocam_20120424_1245.jpg ( 2012-04-24 12:45:02 ) Full size: 1920x1440
Bee in flight

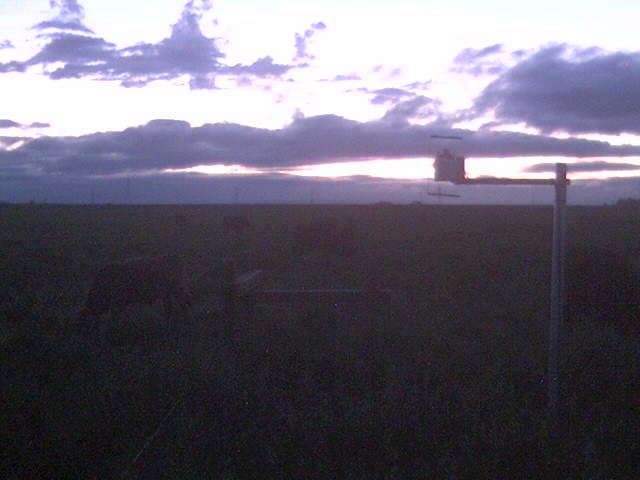
SI_webcam_20121141915.jpg ( 2012-04-23 19:15:04 ) Full size: 640x480
Nice sunset with cows

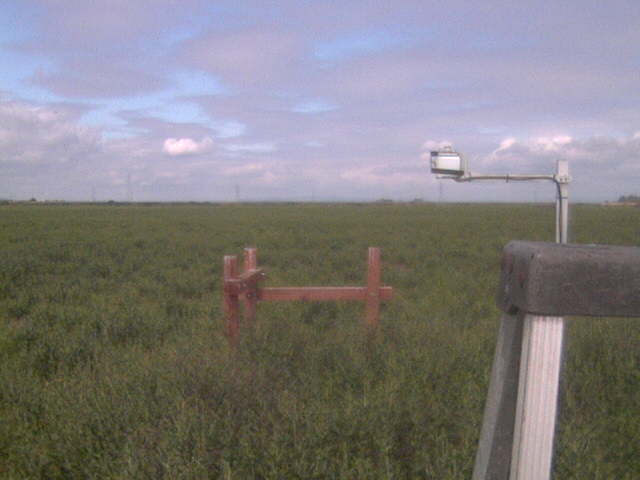
SI_webcam_20121150919.jpg ( 2012-04-24 09:19:04 ) Full size: 640x480
field work
7 sets found
No data found for SI_mp.
11 SI_met graphs found
Can't check SI_mixed
2 SI_mixed graphs found
5 SI_flx graphs found
3 SI_soilco2 graphs found
Can't check TWSI_mixed
Can't check SIMBTWEE_met

