Field Notes
<--2012-04-03 10:30:00 | 2012-04-24 09:30:00-->Other sites visited today: Mayberry | Twitchell Rice | West Pond
Phenocam link: Searching...
Sherman Island: 2012-04-17 09:30:00 (DOY 108)
Author: Joe Verfaillie
Others: Dennis, Sara, Jaclyn
Summary: Standard field work.
| Sherman
2012-04-17 I arrived about 9:30PDT with Jaclyn and Sara. Dennis was already there. It was cool and breezy. The sky was clear and sunny but with some haze moving in from the west. The field is very green with grass at about 10cm and pepper weed to about 40cm outside the cow fence. Inside the cow fence the pepper weed is almost waist high. The ditch along the road is very full. Standard field work. The 7700 RSSI was 23. After cleaning the bottom mirror it rose to 40 and after cleaning the top mirror it was 86. The wash reservoir was almost full. The wells in the field are full of sediment. We will remove them and put a new well inside the cow fence. The CR1000 card was very slow to format. Probably should take it out of rotation. |
2 photos found

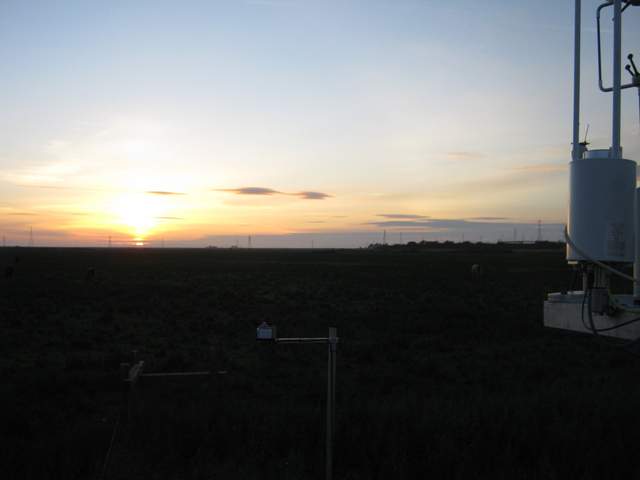
SI_autocam_20120418_1845.jpg ( 2012-04-18 18:45:02 ) Full size: 1920x1440
Nice sunset

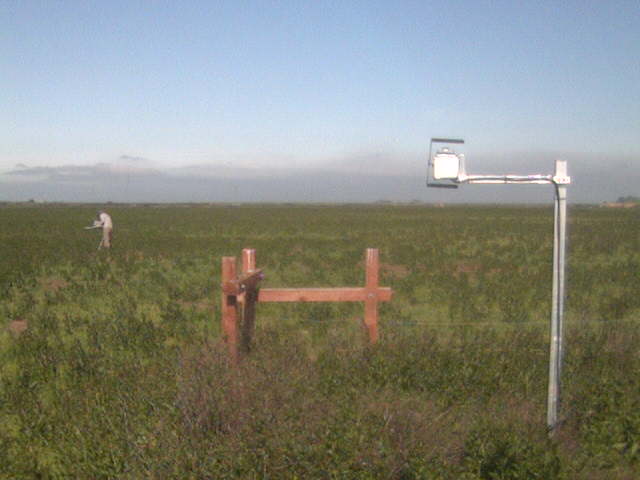
SI_webcam_20121080845.jpg ( 2012-04-17 08:45:04 ) Full size: 640x480
Jaclyn field work
7 sets found
No data found for SI_mp.
11 SI_met graphs found
Can't check SI_mixed
2 SI_mixed graphs found
5 SI_flx graphs found
3 SI_soilco2 graphs found
Can't check TWSI_mixed
Can't check SIMBTWEE_met

