Field Notes
<--2011-07-14 11:15:00 | 2011-07-28 11:00:00-->Other sites visited today: Mayberry | Twitchell Rice
Phenocam link: Searching...
Sherman Island: 2011-07-21 11:30:00 (DOY 202)
Author: Joe Verfaillie
Others: Jaclyn, Jose, Maribel
Summary: Blown UPS took down all 12VDC systems, replaced computer, added new 12VDC power with solar controller, replaced met data logger with new program.
| Sherman
2011-07-21 I arrived about 11:30 with Jaclyn, Jose and Maribel. It was clear, hot and sunny. The breeze we enjoyed at Mayberry seems to have died a bit. Most of the pepper weed flowers are brown, but still some white here and there. From the middle of the field to the west is very wet with standing water outside of the ditches. But the ditch along the east side of the field and the east part of the northern ditch do not have standing water. There are cows in the field to the east and cows in our field stayed far to the west. I pulled the UPS that was protecting the 12V systems and the computer. It seems to have overheated warping the plastic case. It had not been supplying power since about 10 days ago shortly before Jaclyn found the computer off last week. I added a brand new deep cycle battery under the AC unit on the north side on the box and the solar charge controller I brought in from Tonzi yesterday. Now all the 12V systems including the computer are backed up me this battery and charged by the 3A 12V supply plugged into a power strip at the back on the rack. I swapped the silver box of the met CR10X back to the original one with a new program. The new program runs the diffuse PAR at a 2 second scan in table 1 and the regular met at a 10 second scan in table 2. It seemed to be working but I will have to look at the data carefully next week. The new program also does away with some unused channels and a bunch of the unnecessary standard deviation columns. I think I left the other CR10X in pieces on top of the met box, and maybe left the door unfastened. New CR10X headers: 1 172 L 2 Year_RTM L 3 Day_RTM L 4 Hour_Minute_RTM L 5 Ref_Temp_AVG H 6 CR10_Volt_AVG H 7 Precip_mm_TOT H 8 Pressure_AVG H 9 Air_Temp_AVG H 10 RH_AVG H 11 TC1_2Cm_AVG H 12 TC1_4Cm_AVG H 13 TC1_8Cm_AVG H 14 TC1_16Cm_AVG H 15 TC1_32Cm_AVG H 16 TC1_50Cm_AVG H 17 TC2_2Cm_AVG H 18 TC2_4Cm_AVG H 19 TC2_8Cm_AVG H 20 TC2_16Cm_AVG H 21 TC2_32Cm_AVG H 22 TC2_50Cm_AVG H 23 TC3_2Cm_AVG H 24 TC3_4Cm_AVG H 25 TC3_8Cm_AVG H 26 TC3_16Cm_AVG H 27 TC3_32Cm_AVG H 28 SHF_1_AVG H 29 SHF_2_AVG H 30 SHF_3_AVG H 31 Net_Rad_AVG H 32 PAR_in_AVG H 33 PAR_out_AVG H 34 Theta_P1_AVG H 35 Theta_P2_AVG H 36 Theta_P3_AVG H 37 Shelter_T_AVG H 38 Red_in_AVG H 39 Red_out_AVG H 40 Nir_in_AVG H 41 Nir_out_AVG H 42 CNR1_PRT_AVG H 43 CM1_Up_AVG H 44 CM1_Dn_AVG H 45 CG1_Up_AVG H 46 CG1_Dn_AVG H 47 DfPar_AVG H 48 Net_Rad_STD H 49 PAR_in_STD H 50 PAR_out_STD H 51 Red_in_STD H 52 Red_out_STD H 53 Nir_in_STD H 54 Nir_out_STD H 55 CNR1_PRT_STD H 56 CM1_Up_STD H 57 CM1_Dn_STD H 58 CG1_Up_STD H 59 CG1_Dn_STD H 60 DfPar_STD H |
1 photos found

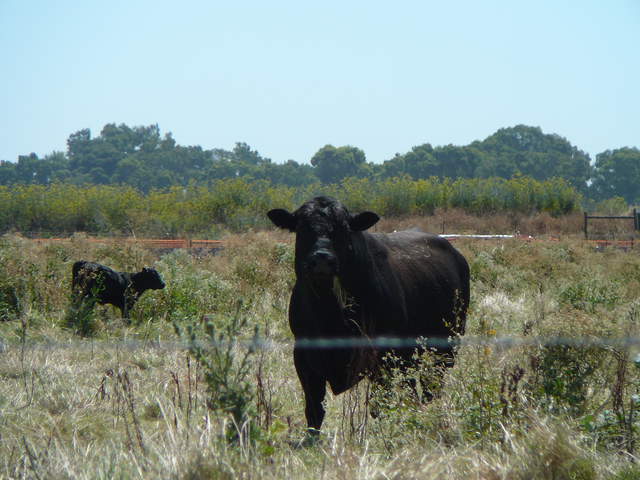
20110721SI_CowsToEast.jpg ( 2011-07-21 10:04:44 ) Full size: 2560x1920
Cow watching us from outside the fence
7 sets found
1 SI_mp graphs found
11 SI_met graphs found
Can't check SI_mixed
2 SI_mixed graphs found
5 SI_flx graphs found
No data found for SI_soilco2.
Can't check TWSI_mixed
Can't check SIMBTWEE_met

