
Field Notes
<--2011-04-26 12:00:00 | 2011-05-25 11:00:00-->Other sites visited today: Twitchell Rice | Sherman Island
Phenocam link: Searching...
Mayberry: 2011-05-13 11:30:00 (DOY 133)
Author: Joe Verfaillie
Others: Jaclyn, Dennis, Emily
Summary: Water level lower, Forgot to collect 23X met data, could not connect to LI7700 with netbook, adjusted autocam timing, LI7700 reservoir empty, DO sensore pulled.
| Mayberry
2011/05/13 I arrived about 11:30 with Jaclyn, Dennis and Emily. It was clear and sunny with a strong, cool wind from the west. The wind here was much stronger than Sherman and Twitchell. The water level has gone down 10cm or so. The LI7700 reservoir was empty and its RSSI was 9%. After I filled the reservoir, and automatic cleaning cycle ran and then I cleaned both the top and bottom mirrors. After cleaning the RSSI was about 90%. I tried to connect to the LI7700 by unplugging the Ethernet from the CR1000 and connecting it to the netbook. All seemed well, but the software could not find the LI7700. After reconnecting to the CR1000, no data was flowing. I cycled power on the CR1000 with no luck and then cycled power on the LI7700 which seemed to work. I swapped the card in the autocam and adjusted its timing. It now starts taking photos at 5:45am and takes 30 images at 30 minute intervals. I think this is PST, so I may need to adjust again. Dennis tested the bubble trap. It was better, but still had a small leak. We pulled the DO sensor near the tower but broke the wire. We brought it back to the lab for repair. After collecting data from the data loggers, I left a serial cable in the box for future use. I forgot to copy the CR23X data. The conductivity sensor was nearly out of the water since the water level dropped. It was put back into the water. The sonic mounted on the tower last visit is sn 000019 and UC# 991003713. The solar system was reading 13.4V, 3.7A solar, 1.3A load. I cleared weeds in front of the lowest solar panel and pulled out a bunch of pepper weed around the tower. The pepper weed has roots just below the soil surface from which new plants can start. Jaclyn collected data from the Tule tower and mapped the nearby tule patches with GPS. |
3 photos found
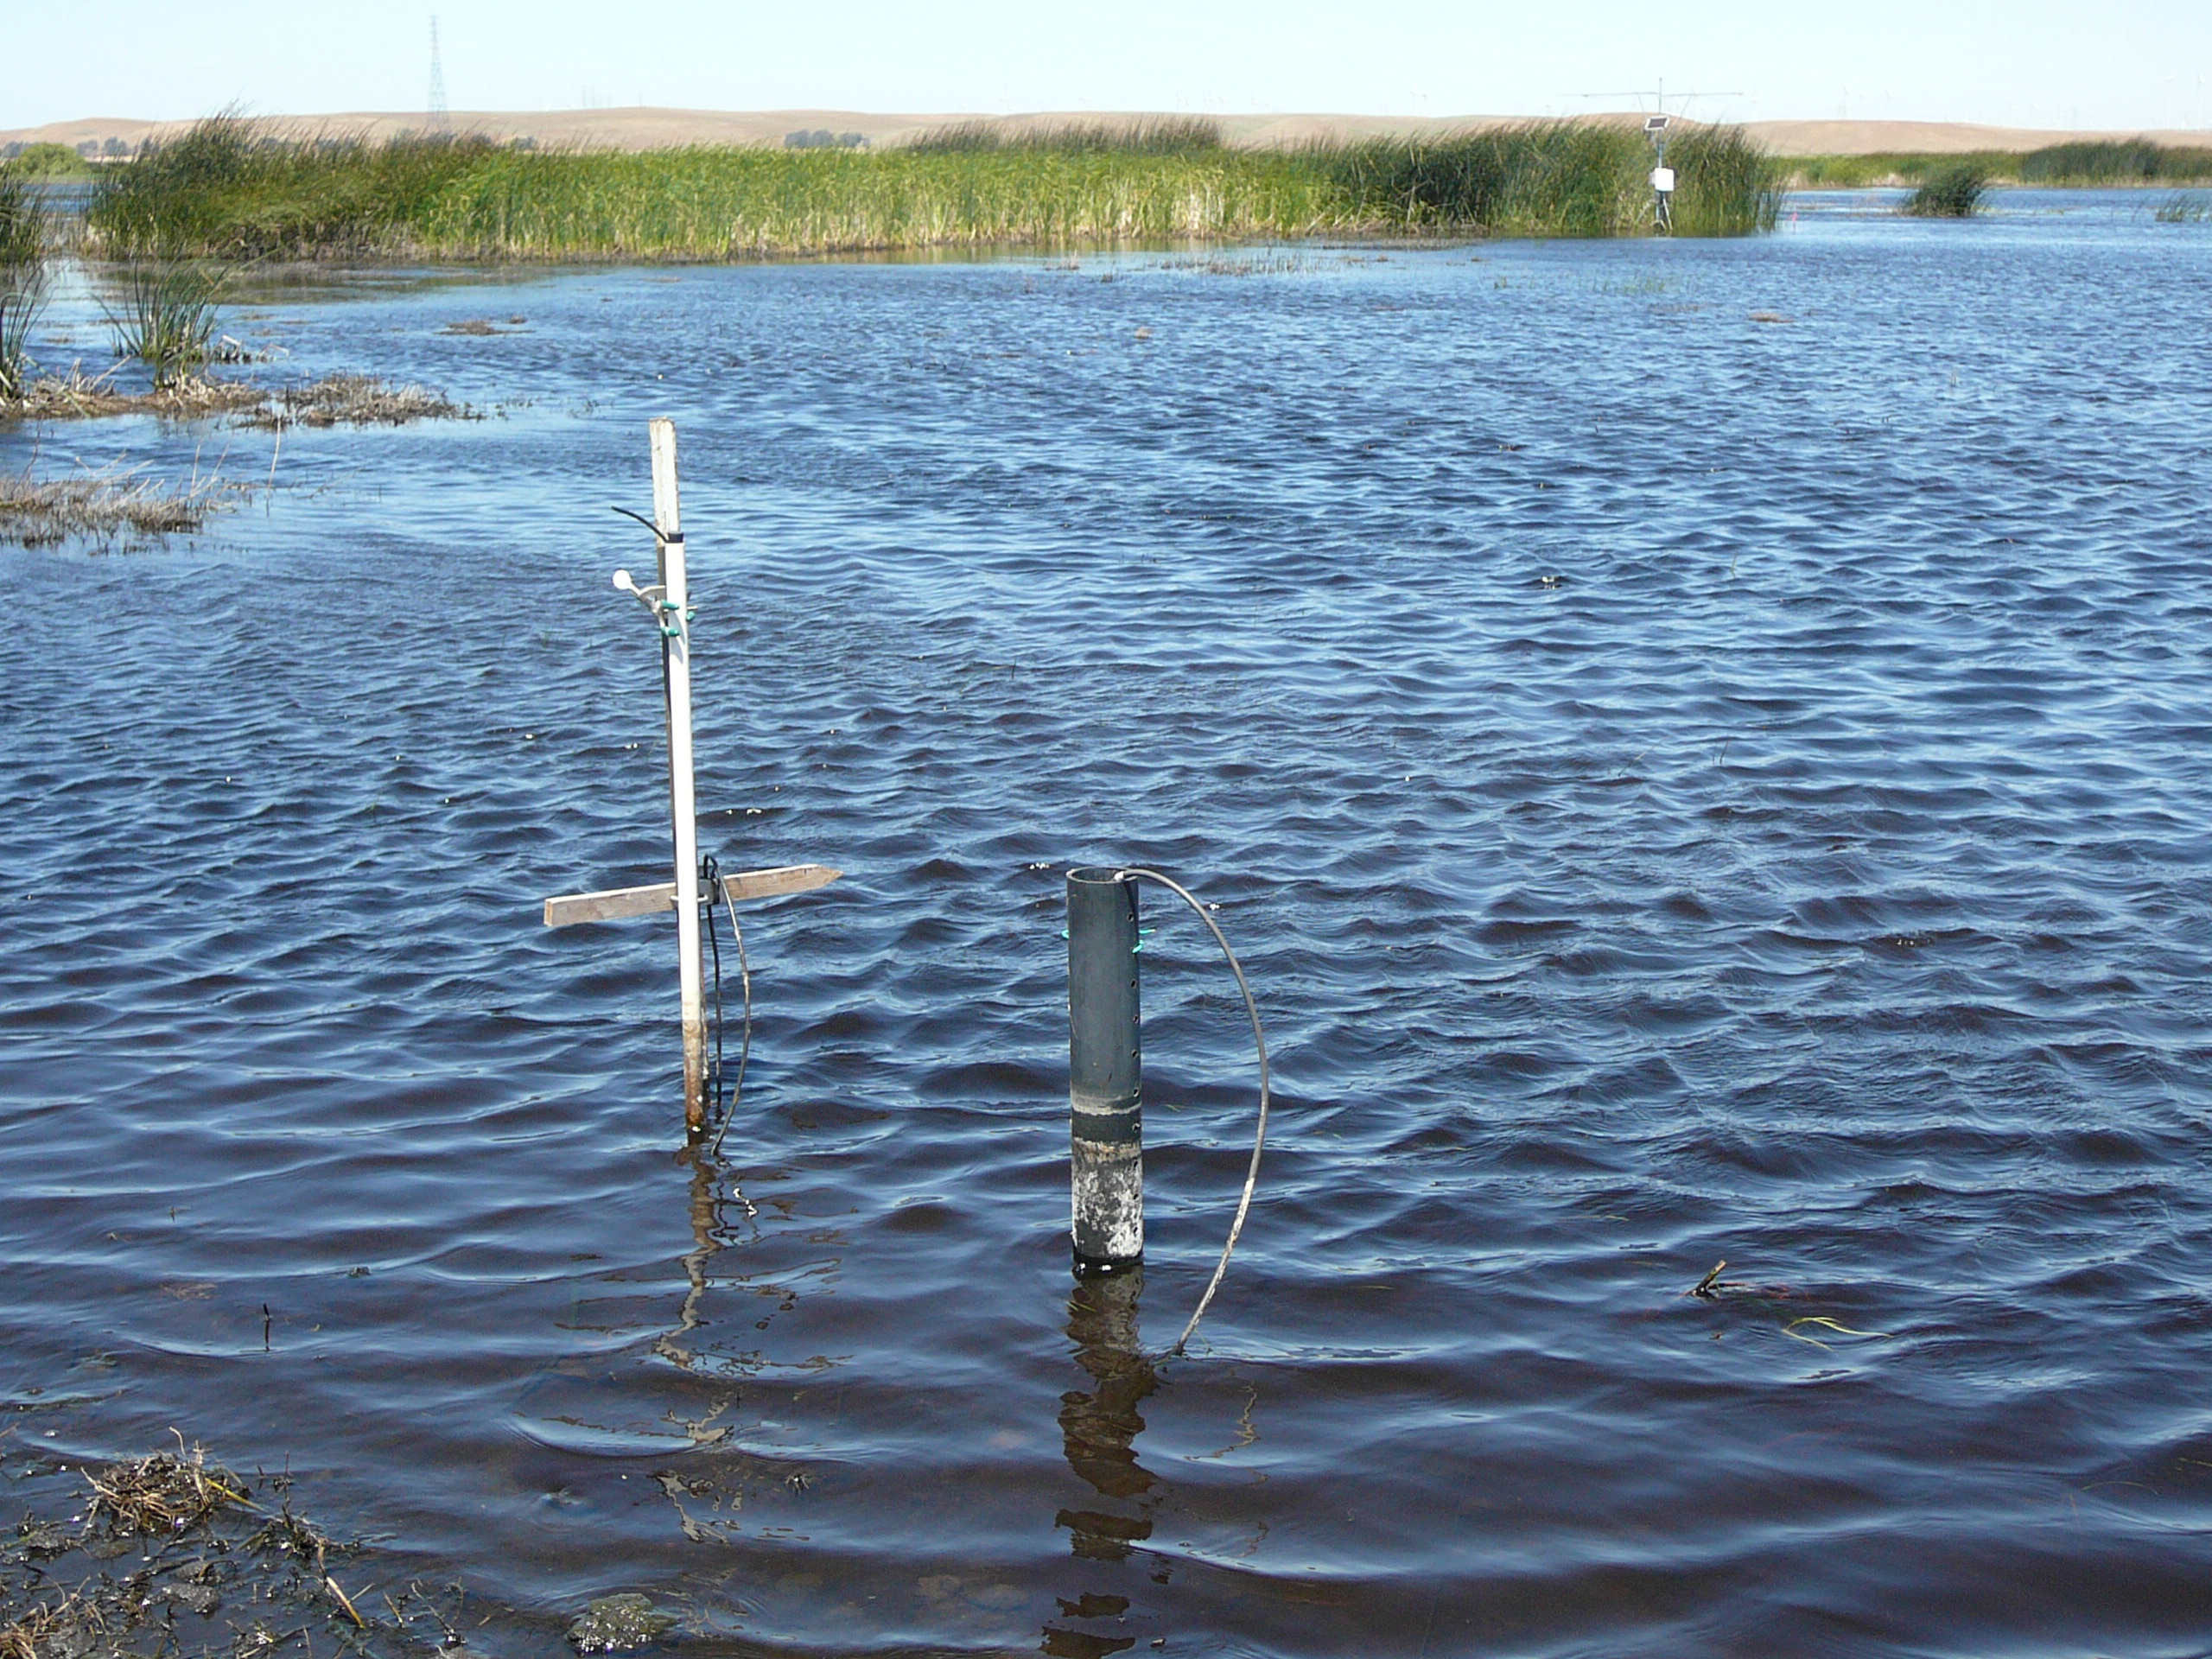
20110513MB_LowerWater.jpg ( 2011-05-13 11:24:47 ) Full size: 2560x1920
Water level has dropped since our last visit
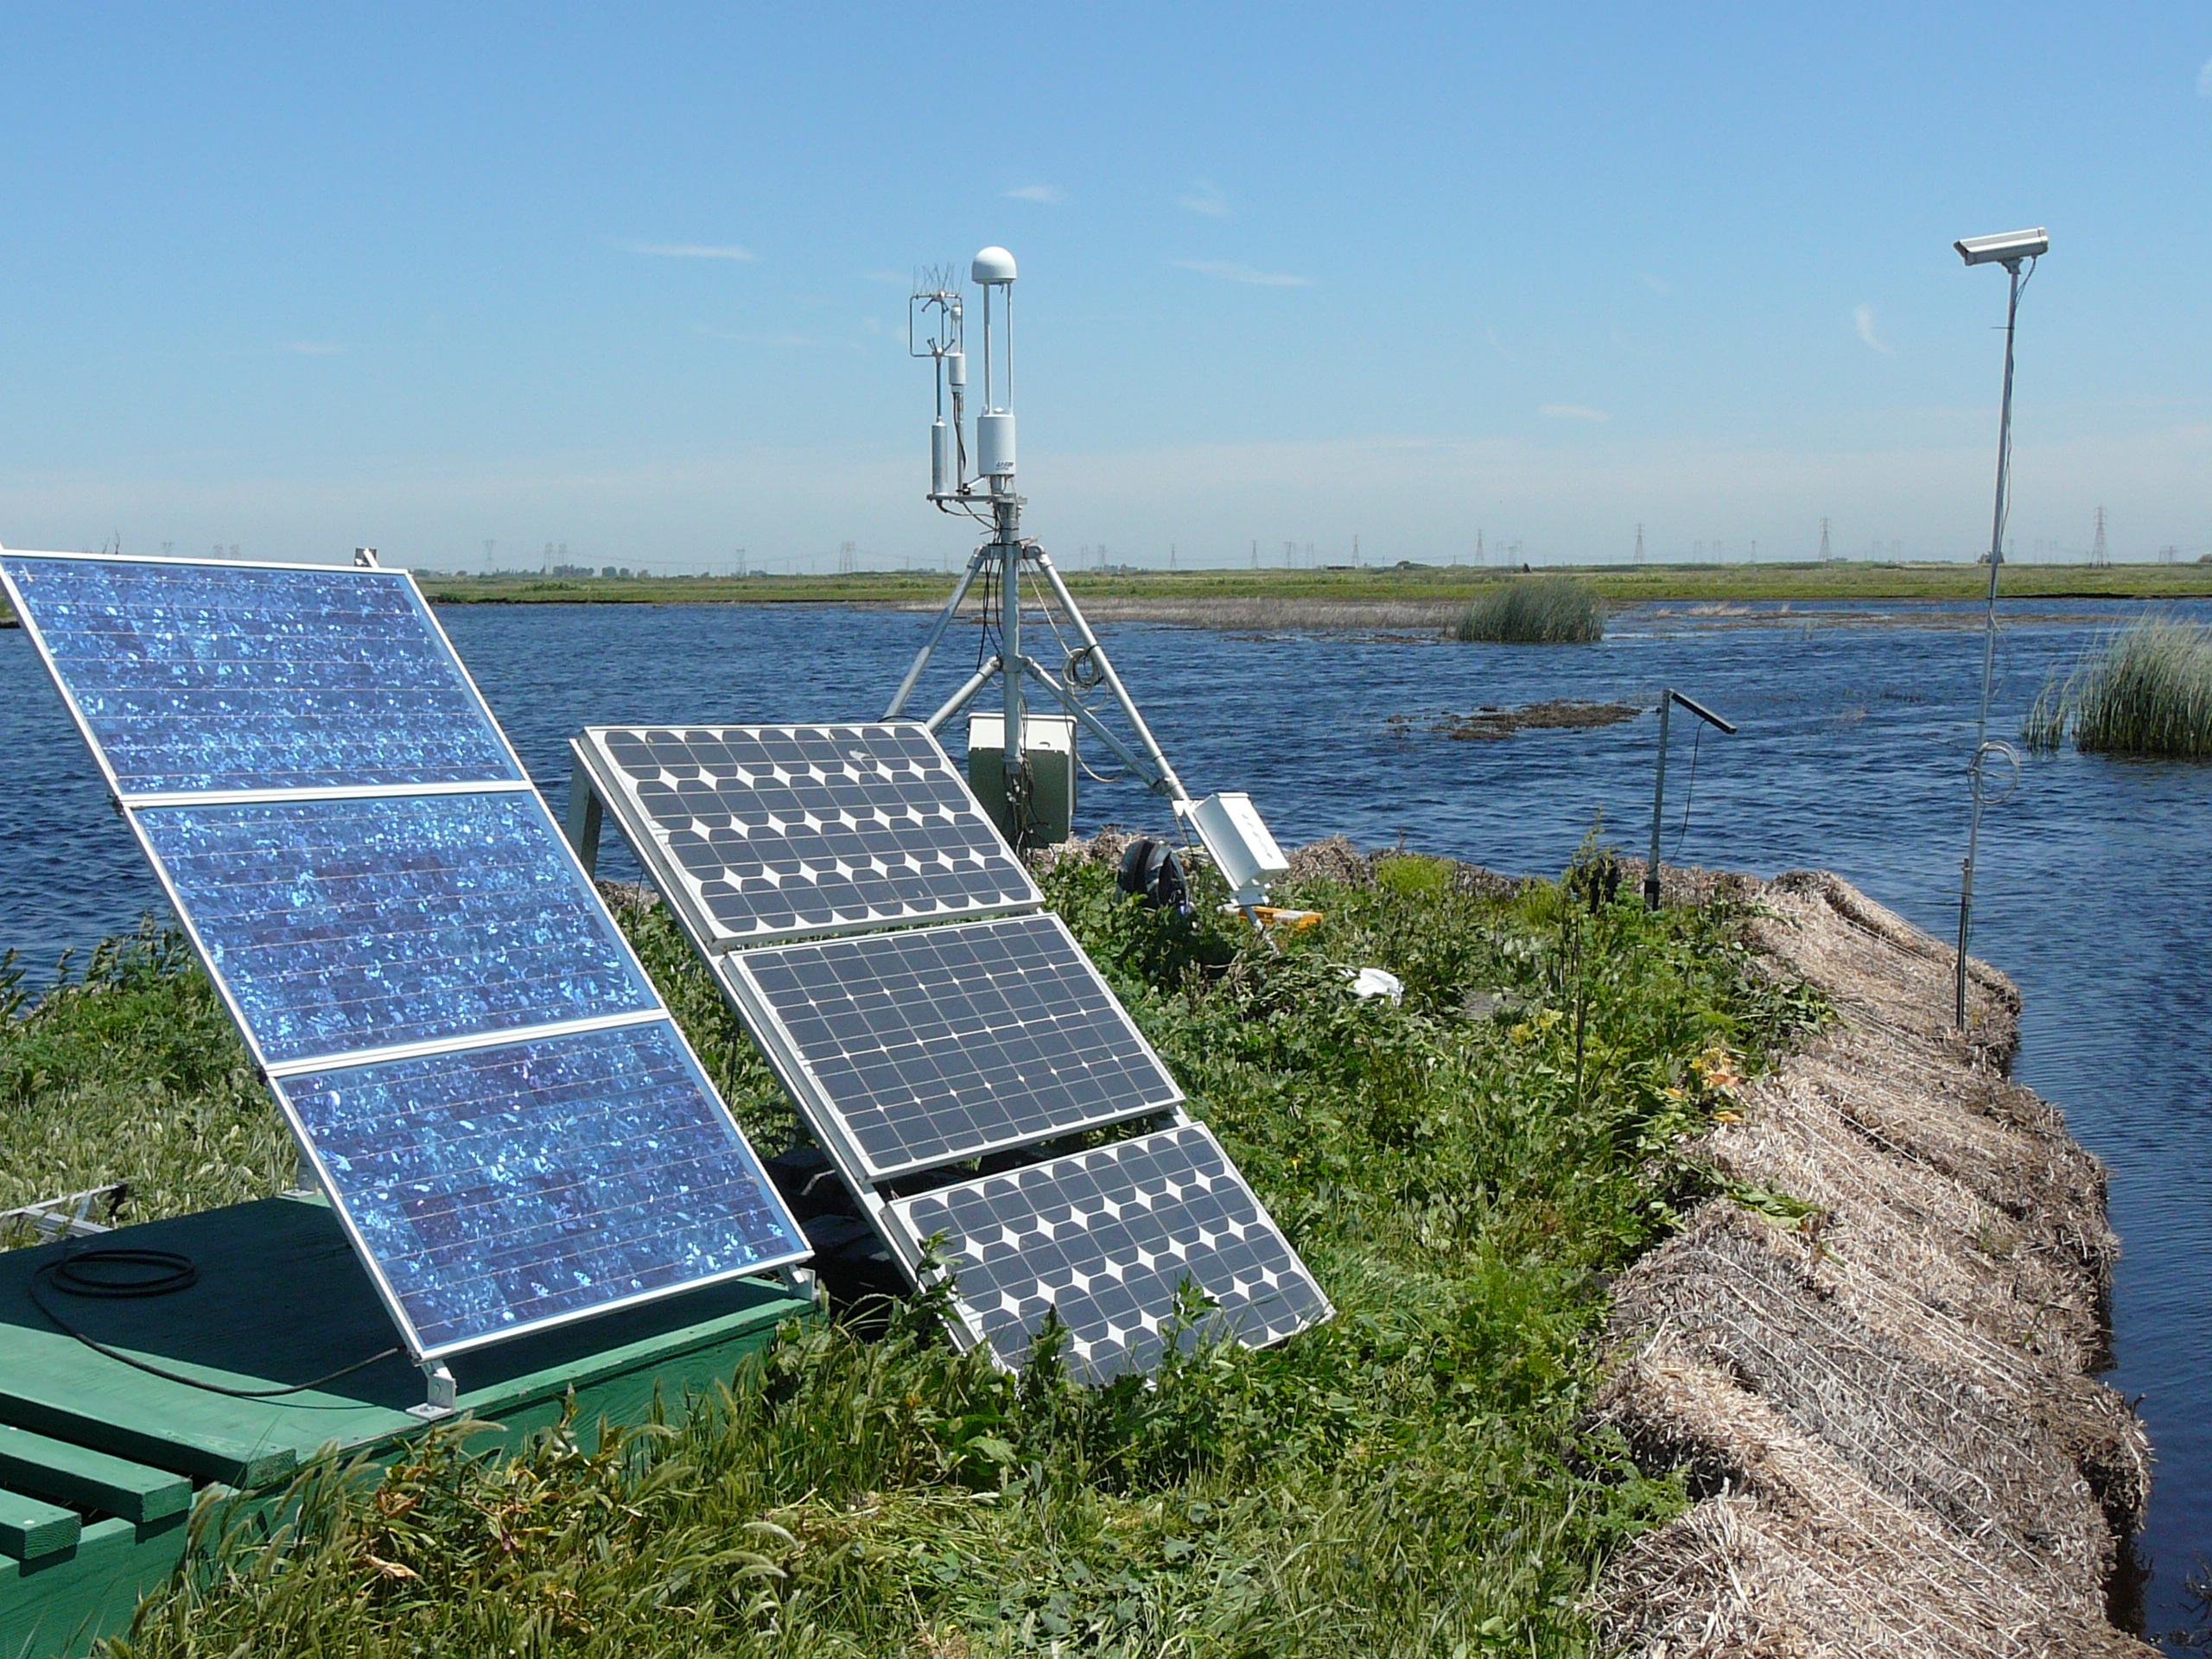
20110513MB_Site.jpg ( 2011-05-13 11:25:21 ) Full size: 2560x1920
Solar panels and tripod tower protected from safflower bales
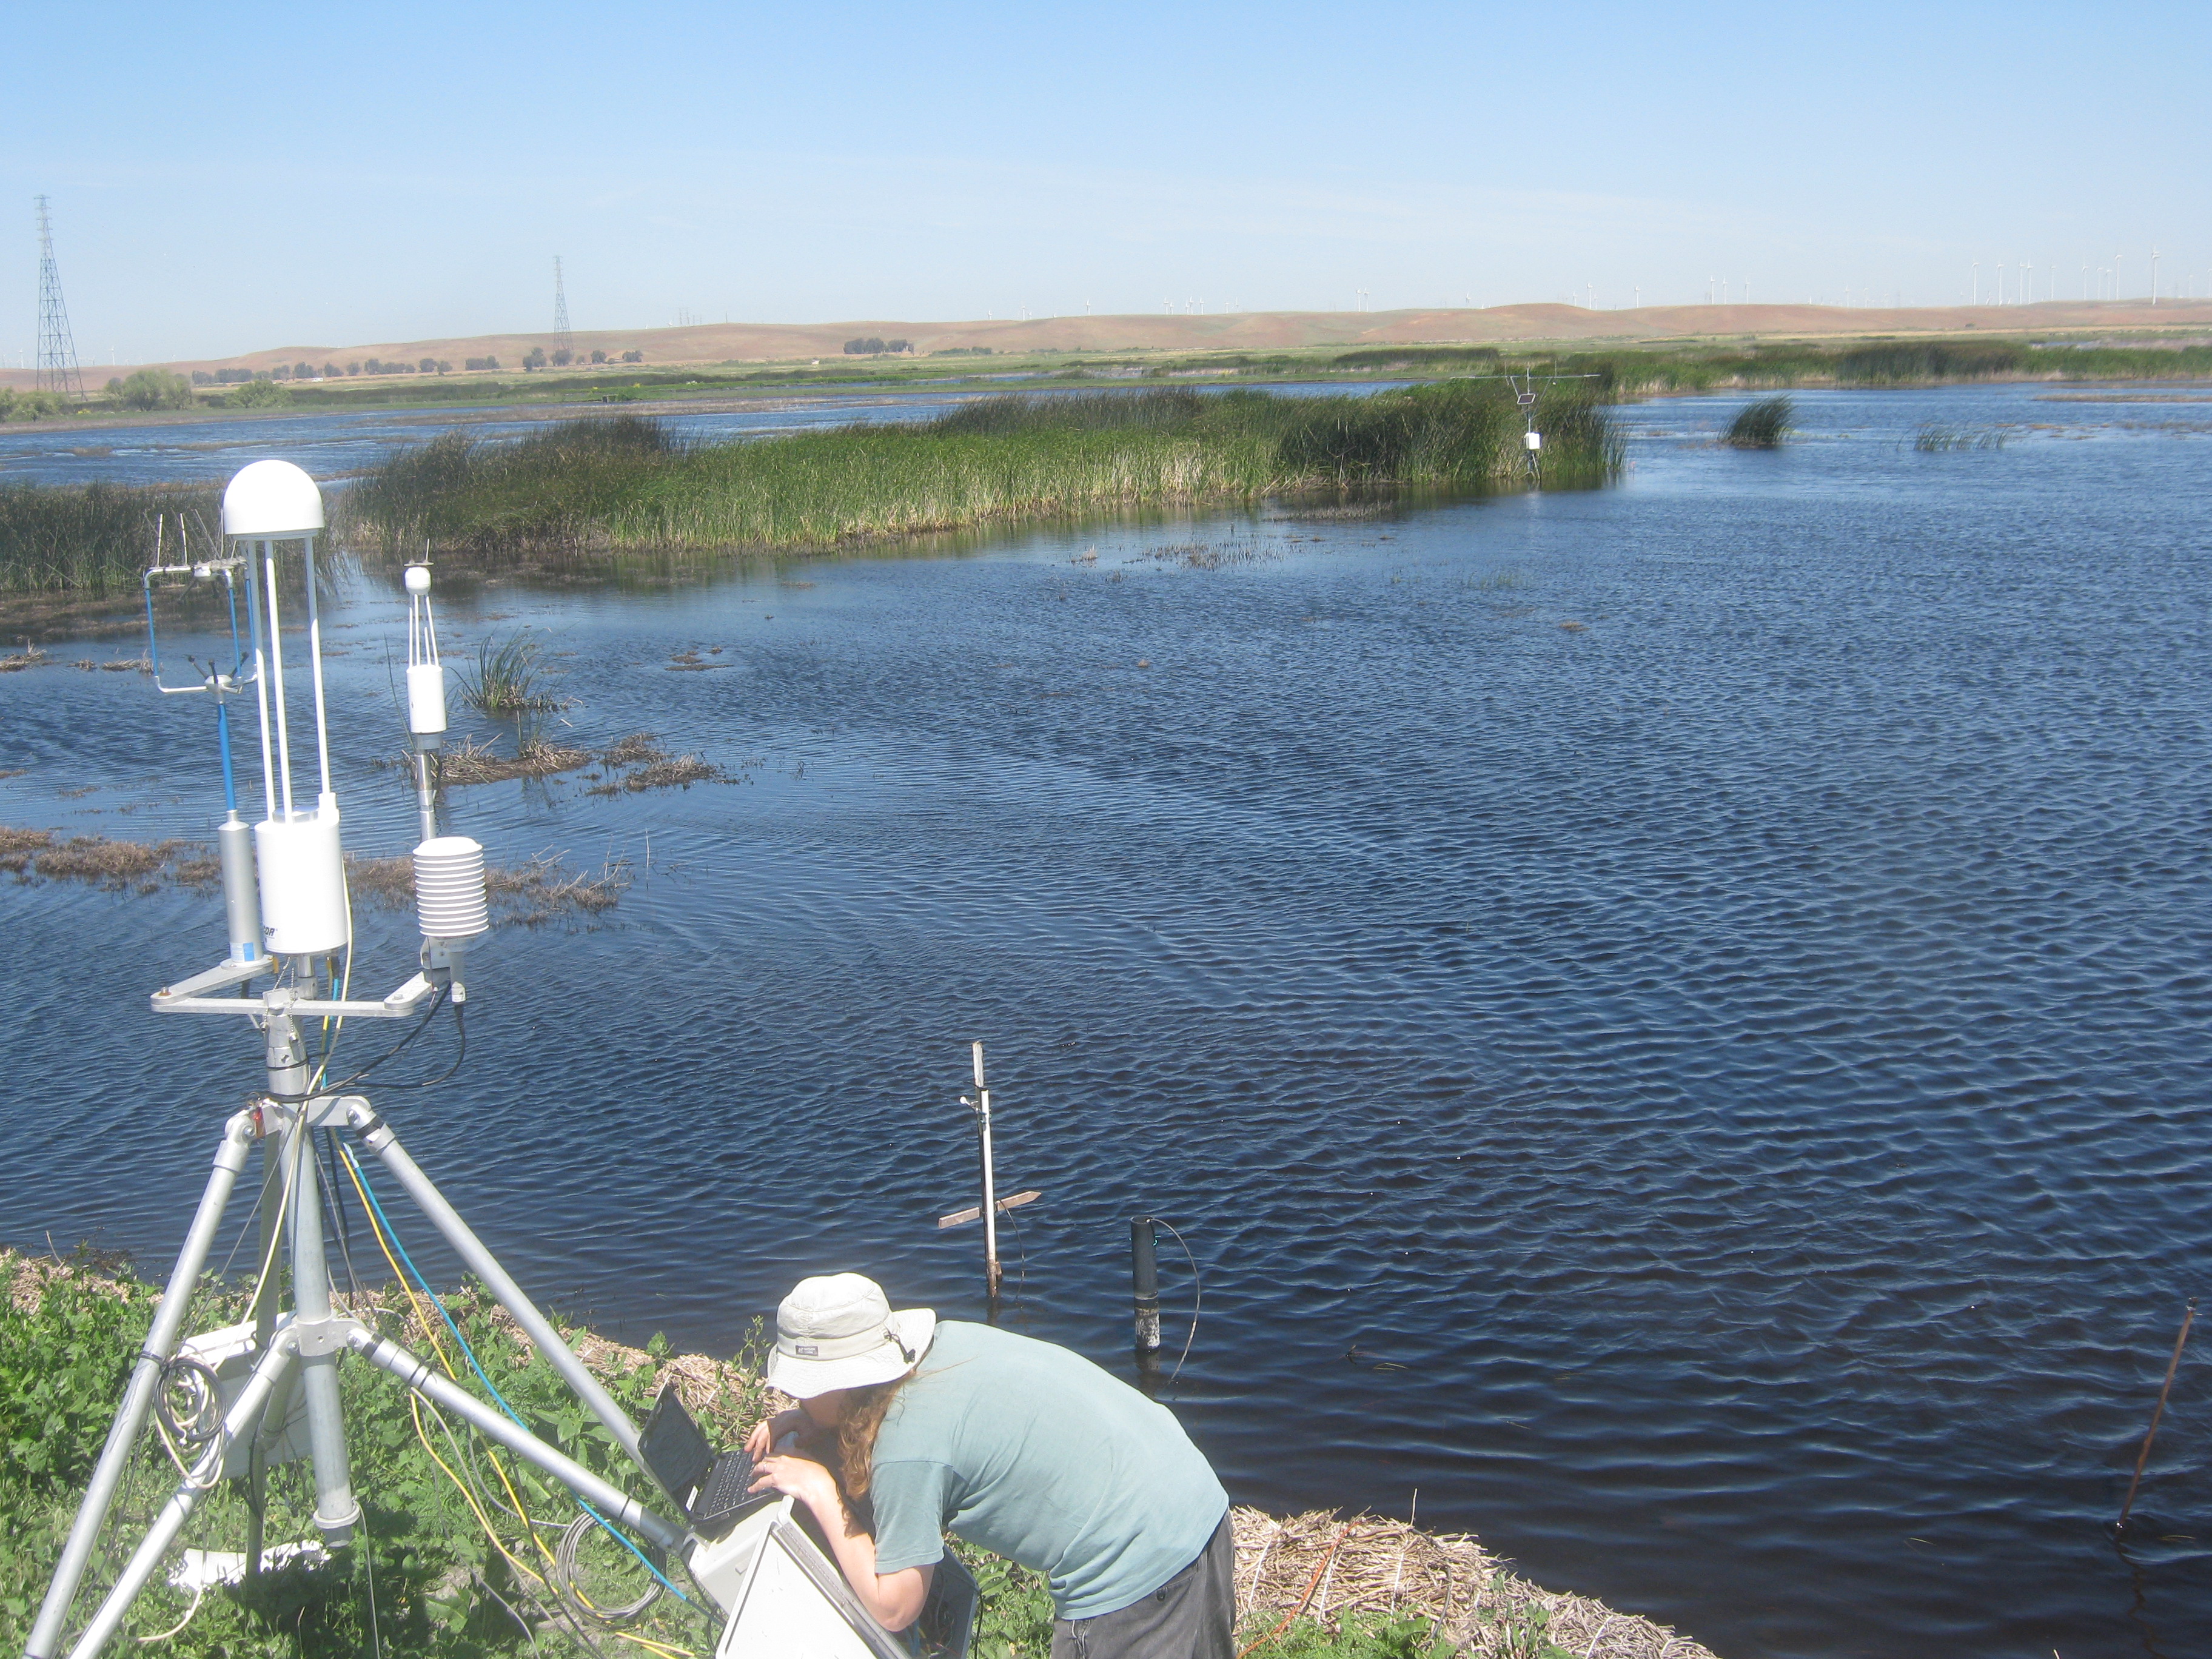
MB_autocam_20110513_1045.jpg ( 2011-05-13 10:45:02 ) Full size: 3648x2736
Joe at the site.
11 sets found
7 MB_flux graphs found
5 MB_met graphs found
28 MB_tule graphs found
Can't check MBWPEESWGT_mixed
1 MB_cam graphs found
Can't check MBEEWPSWEPGT_cam
Can't check SIMBTWEE_met
No data found for MB_minidot.
Can't check MBSWEEWPBCBA
1 MB_processed graphs found
Can't check MB_fd
1 MB_fd graphs found