Field Notes
<--2024-10-10 10:00:00 | 2024-11-15 11:00:00-->Other sites visited today: Vaira
Phenocam link: Searching...
Tonzi: 2024-10-29 10:30:00 (DOY 303)
Author: Joe Verfaillie
Others: Kuno, Jackie
Summary: Installed tree trunk temperatures on the flux chamber trees, first collection of CH4 flux data - seems okay, Tested method to get well water samples.
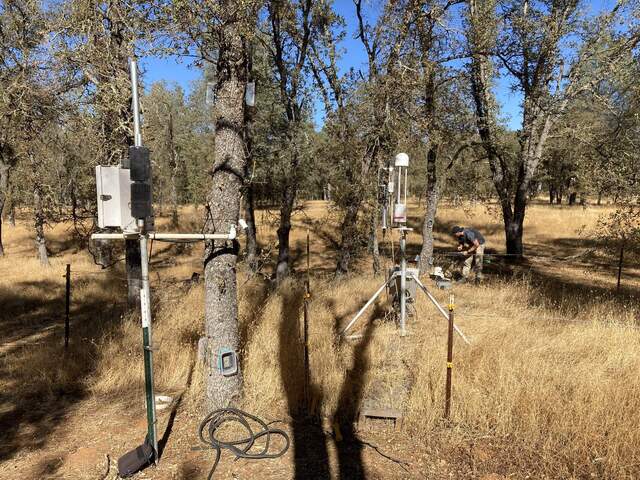
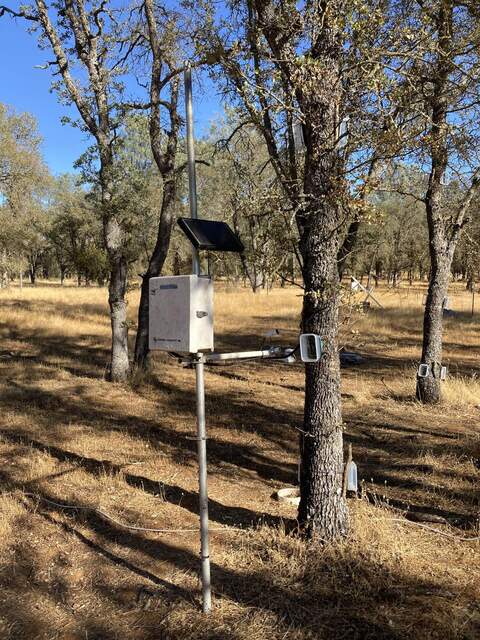
| Tonzi 2024-10-29 Kuno, Jackie and I arrived at about 11:30 PDT. It was clear and sunny but cool. Still very dry but some chances of rain coming later in the week. The trees look about the same as last week - maybe more than half the leaves have fallen. We saw Rob on the way in but just to say hello. We are setting up three systems to measure tree temperature on three oaks that Kuno is measuring stem fluxes on. These are the systems recently removed from GT with the thermocouples rewired as single ended so that two more could be added. A post is attached with hose clamps to a fence driven in to the ground adjacent to the tree of interest. A PVC cross arm holds an IRT sensor. A box and solar panels are mount on the post about head high to try to avoid cows. The boxes each have a CR10x with six thermocouples and a lithium power pack. The thermocouple wires were sort of random lengths so there is a bunch of poorly coiled extra cable in the boxes. Kuno put the thermocouples in holes drilled in the bark at 0.4m, 1.3m, and 2.7m high on both the south and north sides of the tree. The IRT's are point at south and north sides of the trees. I think they are currently angled up and we may want to angle them down so water doesn't collect in the view port. Installed were (double check location next time) East: CR10X sn 13214, IRT sn 7385 West: CR10X sn 3501, IRT sn 7638 North: CR10X sn 19481, IRT sn 1624 They were all logging when we left. The south side of the trees were about 10C higher than the north sides. We need another crossover fitting and mount for solar panels on the west installation. And maybe some aluminum tape to discourage cow chews. Jackie measured the soil moisture, the wells and serviced the zcams. When she did the wells she taped an open vial to the weight and got water samples from each well for head space gas analysis. I cleaned the radiometers, and collected the flux and camera data from the Tower top. The wash box there was full and the RSSI was still in the 70s. There were some spider webs on the eddy sensors that I cleaned off and the bottom mirror did have some dust that I cleaned off. Raising and lowering the post each visit to clean the 7700 is a little annoying. Also I still need to replace the 7700 ethernet cable - it has a crack in it. The 7500 read: 426.9ppm CO2, 335.3mmol/m3 H2O, 14.7C, 99.0kPa, 99.1SS - 101.3 after cleaning The 7700 read: 2.05ppm CH4, 72.9RSSI - 84.7 after cleaning I collected the Floor flux and well data. Here there is no wash box and the RSSI was 17. It may be better to move the wash box from the Tower top down here since this 7700 seems to get dirtier. The Tower wash box needs better mounting anyway. The 7500 read: 419.2ppm CO2, 257.1mmol/m3 H2O, 17.1C, 99.1kPa, 90.0SS After cleaning: 436.8ppm CO2, 303.4mmol/m3 H2O, 17.1C, 99.1kPa, 99.7SS The 7700 read: 2.07ppm CH4, 17.8RSSI - 83.4 after cleaning I collected the FD chamber data, read the dendrometers and collected the Road well data and the Tower met data. Still need to test the GMP343 that I removed from the lowest location last time. Kuno did his rounds of stem and soil fluxes. He also took cores from the sample trees. The threaded point of one corer broke off inside of one of the trees. We left at about 15:00 PDT |
Field Data
No tank data
Well Depth
| Date | Location | Depth (feet) |
|---|---|---|
| 2024-10-29 | TZ_road | 37.3 |
| 2024-10-29 | TZ_tower | 33.7 |
| 2024-10-29 | TZ_floor | 29 |
| 2024-10-29 | VR_well | 59.7 |
No TZ Moisture Point data found
No VR Moisture Point data found
No TZ grass heigth found
No VR grass heigth found
Tree DBH
| Date | Tag# | Reading (mm) |
|---|---|---|
| 2024-10-29 | 1 | 8.0 |
| 2024-10-29 | 102 | 4.0 |
| 2024-10-29 | 2 | 17.1 |
| 2024-10-29 | 245 | 10.8 |
| 2024-10-29 | 3 | 9.2 |
| 2024-10-29 | 4 | 11.5 |
| 2024-10-29 | 5 | 21.2 |
| 2024-10-29 | 6 | 8.9 |
| 2024-10-29 | 7 | 16.7 |
| 2024-10-29 | 72 | 10.1 |
| 2024-10-29 | 79 | 10.8 |
No water potential data found
No TZ Grass Biomass data found
No TZ OakLeaves Biomass data found
No TZ PineNeedles Biomass data found
2 photos found

20241029TZ_FloorKunoStemT.jpg ( 2024-10-29 14:33:36 ) Full size: 1920x1440
New tree trunk temperature logger, Floor eddy flux and Kuno doing chamber fluxes.

20241029TZ_StemT.jpg ( 2024-10-29 14:55:12 ) Full size: 1440x1920
New temperature sensors added to tree trunk chamber measurements
16 sets found
No data found for TZ_Fenergy.
11 TZ_tmet graphs found
No data found for TZ_soilco2.
Can't check TZ_mixed
3 TZ_mixed graphs found
1 TZ_fflux graphs found
8 TZ_fmet graphs found
No data found for TZ_tram.
3 TZ_co2prof graphs found
1 TZ_irt graphs found
No data found for TZ_windprof.
1 TZ_tflux graphs found
8 TZ_sm graphs found
Can't check TZ_met
1 TZ_met graphs found
Can't check TZVR_mixed
8 TZ_osu graphs found
3 TZ_fd graphs found
Tonzi Z-cam data

