Field Notes
<--2023-12-22 15:30:00 | 2024-01-18 15:20:00-->Other sites visited today: Hill Slough | Bouldin Corn | East End | West Pond | Mayberry | Gilbert Tract
Phenocam link: Searching...
Bouldin Alfalfa: 2024-01-04 11:20:00 (DOY 4)
Author: Joe Verfaillie
Others: Dennis
Summary: Alfalfa is green and leafy, but sheep coming soon I think, removed IRTs - end of experiment, main drainage ditch being cleaned.
| Bouldin Alfalfa 2024-01-04 Dennis and I arrived at 11:20 PST. It was clear sunny and mild. The field is green and leafy. Dennis spotted some sheep fencing along the ditch southeast of the tower so it may not stay leafy for long. There was an excavator cleaning the big ditch north of our field along the road. We drove the road on the north side of the ditch, crossed over and came back to our field from the other direction. We drove onto the field but had to get a running start to get back out of the field up onto the road again. Dennis did veg height and a bunch of spectra, but I think the SD card was loose as I didn’t see any files on the card. At the tower I collected the flux, met, camera and FD data. The 7500 read: 436.9ppm CO2, 417.4mmol/m3 H2O, 13.1C, 102.5kPa, 98.5SS The tipping bucket was clean. The incoming PAR was really dirty. The under canopy PAR was clean. I removed the Corteva IRT system as that experiment is finished. CR1000X sn 1130, power controller sn 1688, and IRTs sn 1071 and sn 1635 came off. I still need to get the last data off the uSD card. We left at 11:50 PST Driving out on the upper levee road is much better than the muddy road at the levee base. |
Next Mowing: 2024-01-05
Veg Height (cm): Tape measure from ground to top of plant
28, 26, 26, 28, 25, 17, 27, 34, 27, 36, 27, 28, 28, 22, 32, 33, 29, 27, 27, 31, 26, avg = 27.8, stdev = 4.08
2 photos found

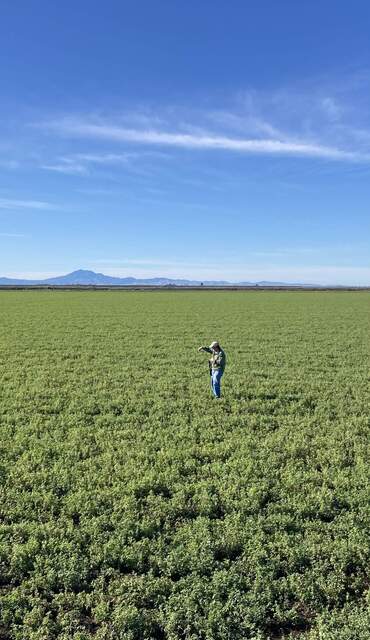
20240104BA_DennisSpectra.jpg ( 2024-01-04 11:32:42 ) Full size: 1110x1920
Dennis taking spectra of alfalfa

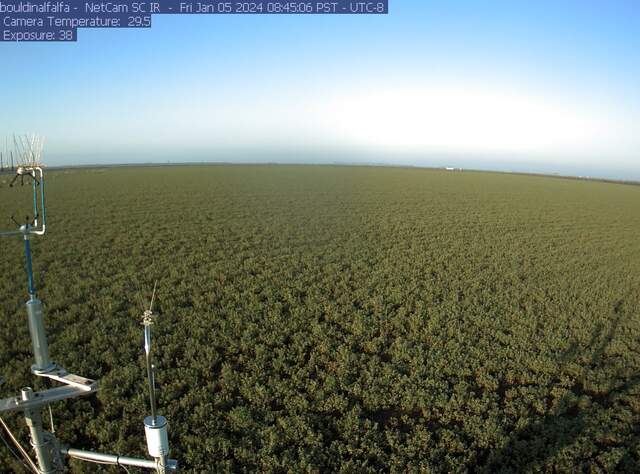
bouldinalfalfa_2024_01_05_084506.jpg ( 2024-01-05 16:45:48 ) Full size: 1296x960
Geese on the field to upper left
7 sets found
4 BA_flux graphs found
21 BA_met graphs found
6 BA_arable graphs found
Can't check TATWBABCSB_cam
Can't check MBSWEEWPBCBA
2 BA_processed graphs found
No data found for BA_adex.

