
Field Notes
<--2023-12-22 16:50:00 | 2024-01-11 16:15:00-->Other sites visited today: Bouldin Corn | Bouldin Alfalfa | East End | West Pond | Mayberry | Gilbert Tract
Phenocam link: Searching...
Hill Slough: 2024-01-04 09:18:00 (DOY 4)
Author: Joe Verfaillie
Others: Dennis
Summary: Quick grab of year end data. All seemed well.
| Hill Slough 2024-01-04 Dennis and I arrived at 9:18 PST. It was clear sunny and mild with almost no wind for a change. The tide was high: water level was 5.90ft at 9:47. There was a flock of white pelicans far out on the water. This was a smash and grab field visit to get the end of year data. I collected the miniDot data. The sock was full of shrimp as usual but no problems were noted. I did not disturb the other water sensors. The enclosure door latch here needs to be reattached. At the tower Dennis refilled the wash reservoir by 1/3 and cleaned the eddy and radiation sensors. The 7500 read: 441.9ppm CO2, 398.2mmol/m3 H2O, 13.2C, 102.9kPa, 103.4SS The 7700 read: 2.09ppm CH4, 56.5RSSI – 74.0 after cleaning The door of the 7550 box was closed but not latched. I didn’t see any evidence of water inside and made sure it was latched before we left. The rain bucket was clean. I collected the flux, met and camera data. I pulled pore water for salinity. I stuck the probe in both the first batch of water drawn and again in the second batch with no change in readings. Original uncompensated readings: Porewater, 6.8mS, 11.3C, flush uncompensated Porewater, 6.8mS, 11.3C, uncompensated Surface water, 4.03mS, 10.0C, uncompensated Daphne calculated temperature-compensated conductivities using the EC300A's default temperature coefficient of 1.91%. Porewater, 9.2mS, 11.3C, flush Porewater, 9.2mS, 11.3C Surface water, 5.6mS, 10.0C We left at 9:50. |
1 photos found
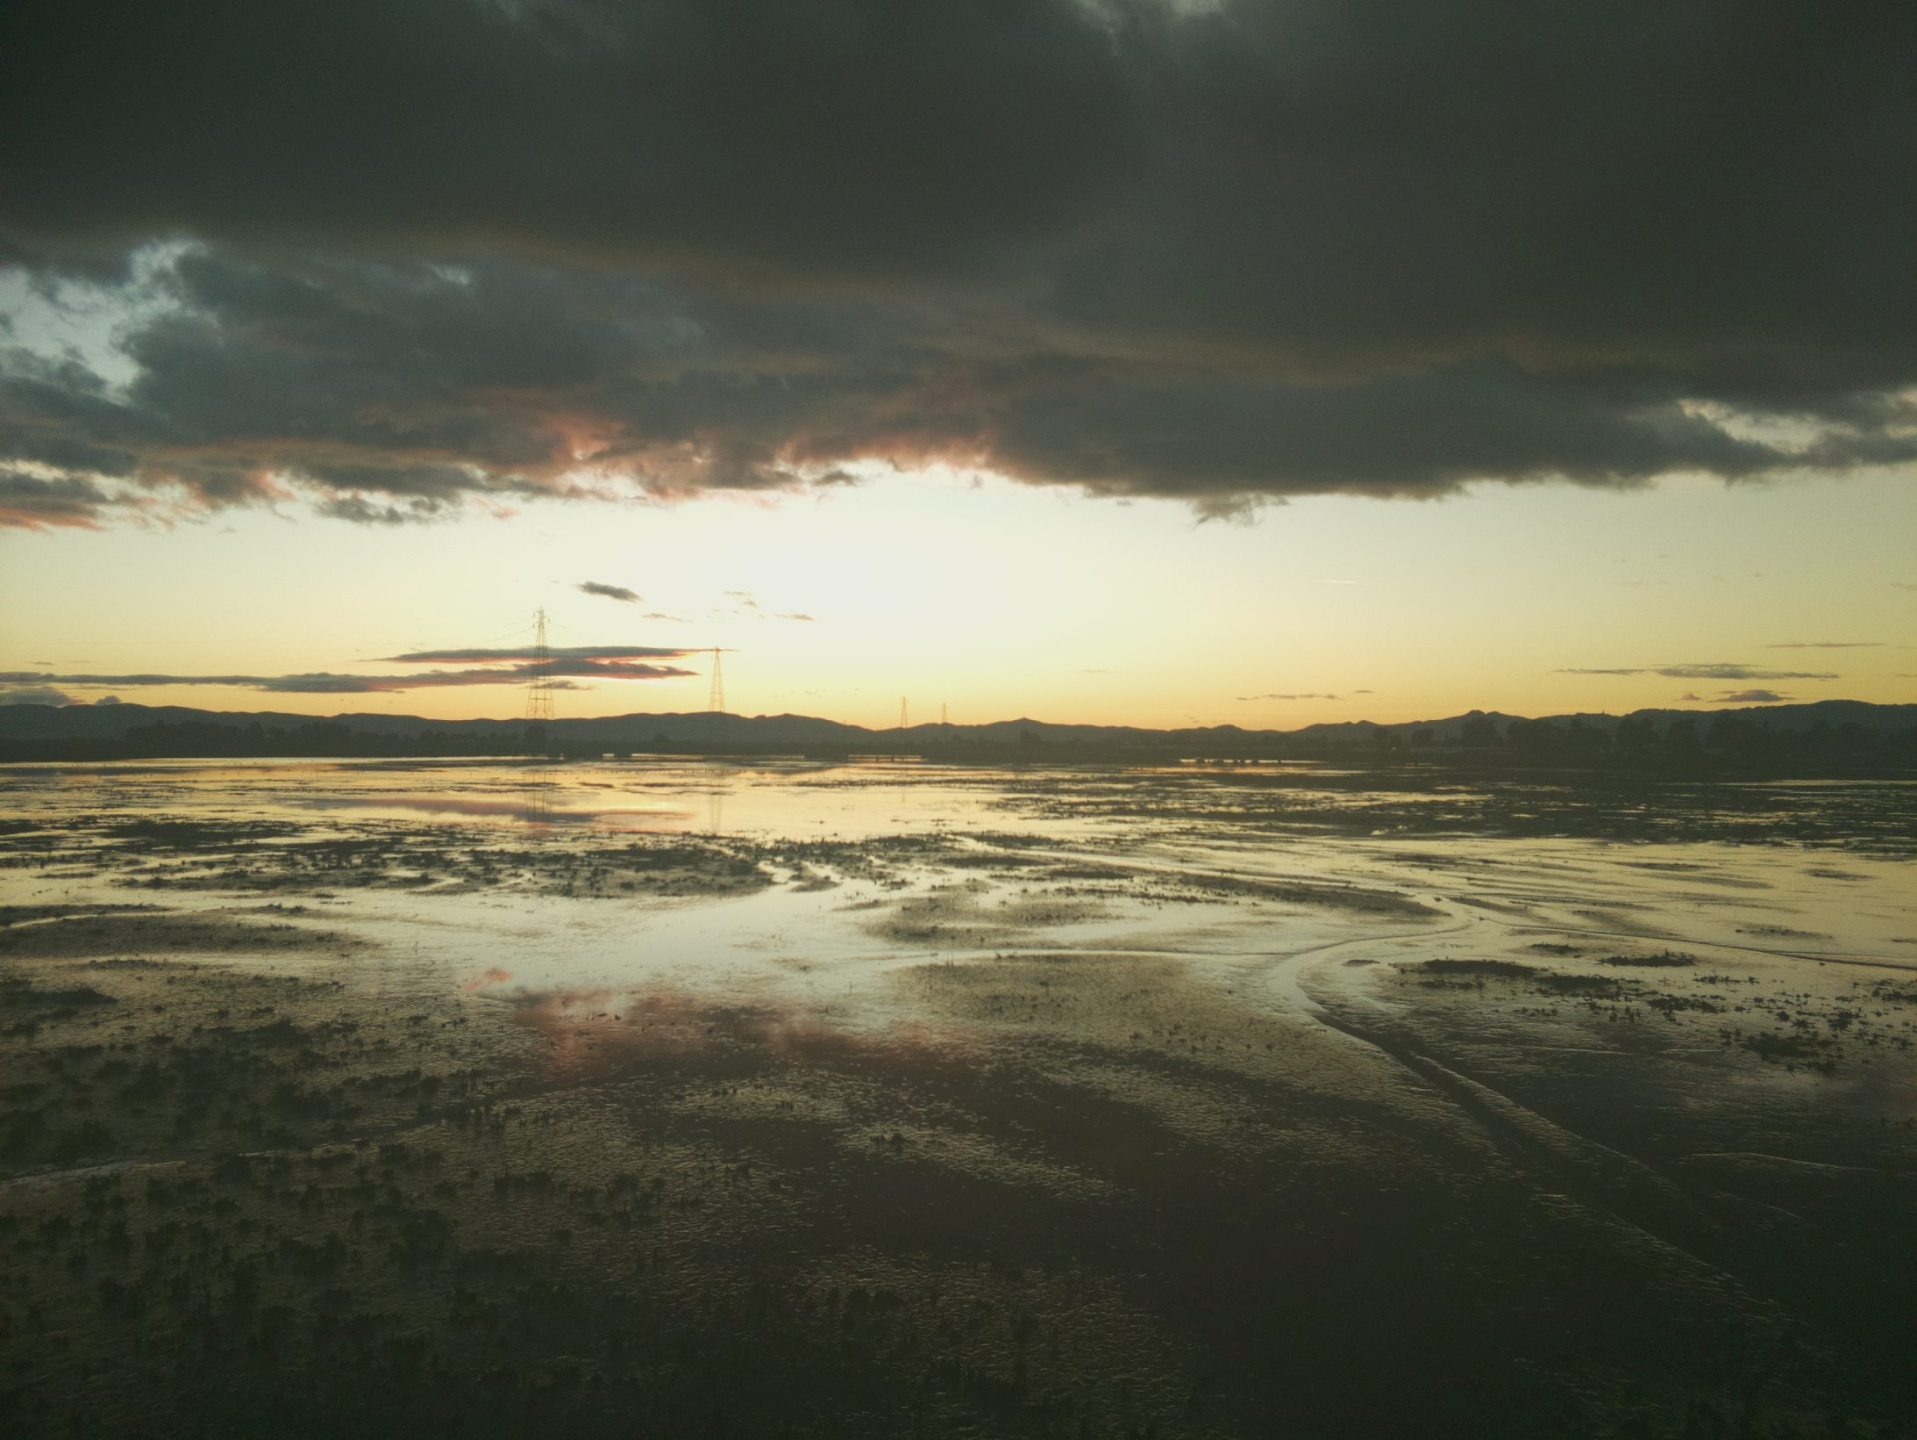
HS_picam_20240103_1715.jpg ( 2024-01-03 17:15:06 ) Full size: 1917x1440
Interesting light at low tide
4 sets found
21 HS_met graphs found
4 HS_flux graphs found
1 HS_cam graphs found
Can't check HS_Processed
2 HS_Processed graphs found