
Field Notes
<--2025-06-19 10:00:00 |Other sites visited today: Vaira
Phenocam link: Searching...
Tonzi: 2025-07-08 11:00:00 (DOY 189)
Author: Joe Verfaillie
Others: Charlie
Summary: Standard fieldwork, Troy has removed the SIF trailer, Tower sonic bird spike disturbed, plume of smoke to the north, new spray head on the Floor 7700, collected point dendrometers, troubleshot SWP_C, new power pack for OSU SP3
| Tonzi 2025-07-08 Charlie and I arrived at about 12:00 PDT. It was hot and sunny with a nice breeze that made it tolerable in the shade. The pond continues to shrink. Only some tar weed on the ground that is still green. Troy came and got the SIF trailer sometime in the last couple weeks. He's in Montana and the trailer will eventually follow him there. He's got plans to write up the data he got at Tonzi. There are two anchors they couldn't get out and one solar panel current powering the 7700 on the floor left from him. He didn't seemed concerned about getting those back. Charile got started with Kuno's chamber work. More comfortable this time but still took almost five hours. Small sinks and sources. I got started on the tower. I set up the new laptop to get the tower top GPS data and collected the eddy, and camera data. I cleaned the eddy sensors and the radiometers. The wash reservoir was full. Both RH/T ventilation fans were good. The bird spikes are on the sonic were disturbed and one was missing - new ones for next time. I could see a plume of smoke to the north from the tower - maybe a controlled burn. The 7500 read: 416.7ppm CO2, 500.3mmol/m3 H2O, 25.2C, 99.2kPa, 106.5SS - 109.6 after cleaning The 7700 read: 1.97ppm CH4, 60.0RSSI - 83.7 after cleaning I collected the Floor flux and well data. I swapped the spray head for the one Patty gave me from Eden that was plugged up and I fixed in the lab. I think it is a better spray that the home made one and the cheap pump seems to supply plenty of pressure. The 7500 read: 427.1ppm CO2, 499.1mmol/m3 H2O, 29.2C, 99.4kPa, 96.6SS The 7700 read: 1.999ppm CH4, 62.2RSSI - 76.5 after cleaning The wash reservoir here too was full. I did the manual well readings, read the dendrometers, collected the tree bole temperature data, collected the FD data and serviced the zcams. I also did the quarterly collection of the automated point dendrometers. The HISE on the tree closest to the road had some bad values. I unplugged and replugged the sensor jack. Probably should check it next time. The TOMST on the little pine had nearly been over grown by the trunk. I removed the sensor, dug a nut out of the bark, unscrewed the bolt out of the trunk about a cm and reinstalled the sensor. The other pines are getting close too. I need to note the min and max values for both the TOMST and HISE point dendrometers so I can know when they need to be physically adjusted. I tried to troubleshoot the METER soil water potential sensor on the OSU SP1 system. Yesterday, I stripped that data logger program down to the essentials and remotely sent it to the CR3000 - big change in data columns. Still, I can use the terminal to read the METER SWP sensor but the instruction in the program returns NAN. It was on control port 3, but 5 was open too, so I moved it to five and updated the program same symptoms. I've queried Campbell. OSU SP3 has been mostly dead due to a failed solar battery. I added the big lithium power pack and used a DC-DC converter to connect the solar panel to the power pack's input port. There were a lot of shadows on the panel at the time so I hope I got the voltages right. The system was sending data to the tower later. We left at about 17:00 PDT |
Field Data
No tank data
Well Depth
| Date | Location | Depth (feet) |
|---|---|---|
| 2025-07-08 | VR_well | 55.35 |
| 2025-07-08 | TZ_floor | 24.2 |
| 2025-07-08 | TZ_road | 32.9 |
| 2025-07-08 | TZ_tower | 28.4 |
No TZ Moisture Point data found
No VR Moisture Point data found
No TZ grass heigth found
No VR grass heigth found
Tree DBH
| Date | Tag# | Reading (mm) |
|---|---|---|
| 2025-07-08 | 1 | 18.1 |
| 2025-07-08 | 102 | 8.8 |
| 2025-07-08 | 2 | 19.1 |
| 2025-07-08 | 245 | 14.9 |
| 2025-07-08 | 3 | 11.7 |
| 2025-07-08 | 4 | 15.0 |
| 2025-07-08 | 5 | 9.8 |
| 2025-07-08 | 6 | 10.5 |
| 2025-07-08 | 7 | 17.8 |
| 2025-07-08 | 72 | 9.6 |
| 2025-07-08 | 79 | 13.0 |
Water Potential - mode: raw
| Time | Species | Tree | readings (bar) | ||
|---|---|---|---|---|---|
| 2025-07-08 13:21:00 | OAK | 102 | -36 | -28 | -36 |
| 2025-07-08 13:21:00 | OAK | 92 | -36 | -39 | -40 |
No TZ Grass Biomass data found
No TZ OakLeaves Biomass data found
No TZ PineNeedles Biomass data found
1 photos found
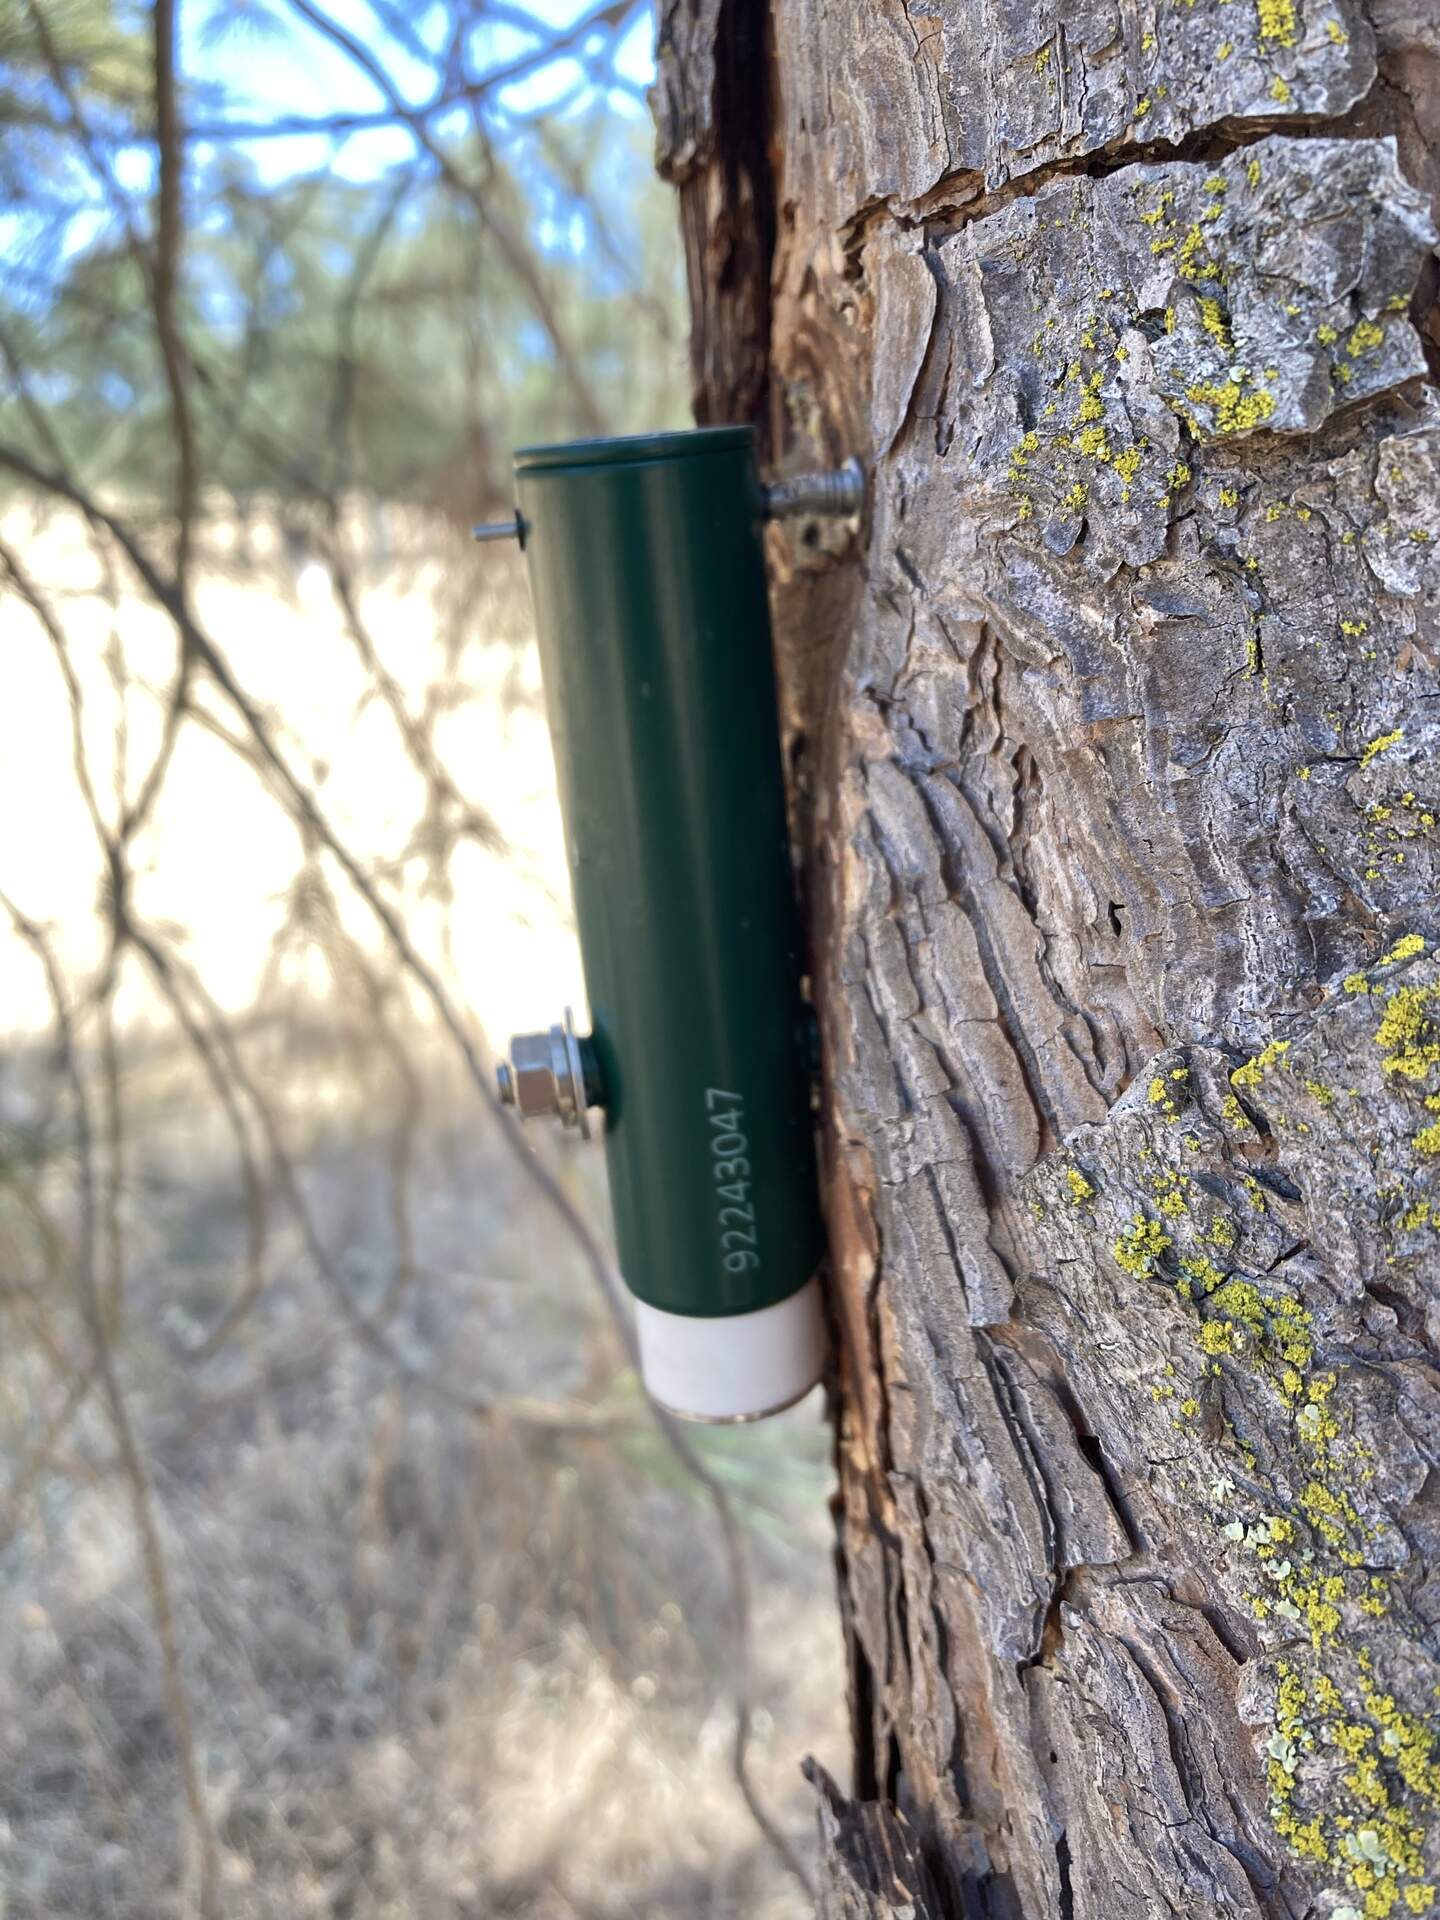
20250708TZ_PointDendrometer.jpg ( 2025-07-08 14:49:34 ) Full size: 1440x1920
The pine tree has grown up to nearly touch the body of the point dendrometer
16 sets found
No data found for TZ_Fenergy.
11 TZ_tmet graphs found
No data found for TZ_soilco2.
Can't check TZ_mixed
3 TZ_mixed graphs found
1 TZ_fflux graphs found
8 TZ_fmet graphs found
No data found for TZ_tram.
3 TZ_co2prof graphs found
1 TZ_irt graphs found
No data found for TZ_windprof.
1 TZ_tflux graphs found
8 TZ_sm graphs found
Can't check TZ_met
1 TZ_met graphs found
Can't check TZVR_mixed
8 TZ_osu graphs found
3 TZ_fd graphs found
Tonzi Z-cam data