
Field Notes
<--2023-11-02 11:45:00 | 2023-11-30 13:10:00-->Other sites visited today: Vaira
Phenocam link: Searching...
Tonzi: 2023-11-13 12:10:00 (DOY 317)
Author: Joe Verfaillie
Others: Daphne
Summary: New batteries for the Floor, Tree 1 FD chamber looks bad, no Moisture point reading due to dead battery, Things look moist, puddles in the road.
| Tonzi 2023-11-13 Daphne and I arrived at about 12:10 PST. It was a mild and sunny fall day with high thin clouds. Rain is coming later this week but they aren’t sure on amounts or timing. Things look moist here, not so crispy and green grass is more wide spread than last time. There are puddles in the road so maybe some rain in the last week. The trees are definitely more brown/yellow than last time but most still have leaves and some even mostly green. We brought new group 27 AGM batteries to upgrade the Floor battery bank sn BB-TF. I shut down the Floor and swapped the batteries. I lost a set of new nuts and washer but the nuts from the old batteries worked on the new. The wires from the batteries to the charge controller are shorter than I would like. The wiring of the solar panels is a mess – but seems correct. I’ve only seen about 4A from the panels when they should max out at about 12A, but maybe the batteries have always been close to full when I was there and the controller was throttling the charge. Daphne started to do soil moisture but somebody left the Moisture Point box power last time and its battery was dead. She worked on dendrometers, z-cams, and the wells. I climbed the Tower to get the tower top data. By the time I came down Daphne had also collected the Floor flux and well data and was working on the FD chambers. The chamber under the tree was reporting mostly zeros. We did a performance check and the CO2 numbers were low but seemed steady. Unfortunately you must update the coefficients before doing anything else otherwise you’ve lost your chance and have to start over. We missed our chance. We brought the chamber sn FD20180048 in for testing in the lab. The Tower read: 426.1ppm CO2, 383.4mmol/m3 H2O, 22.2C, 98.7kPa, 101.1SS The Floor read: 428.1ppm CO2, 367.4mmol/m3 H2O, 22.2C, 98.8kPa, 99.2SS I collected the all the met data from the Tower computer just before we left. We left at about 14:30 PST. |
Field Data
No tank data
Well Depth
| Date | Location | Depth (feet) |
|---|---|---|
| 2023-11-13 | VR_well | 60.12 |
| 2023-11-13 | VR_pond | 13.5 |
| 2023-11-13 | TZ_floor | 28.46 |
| 2023-11-13 | TZ_tower | 33.12 |
| 2023-11-13 | TZ_road | 37.2 |
No TZ Moisture Point data found
No VR Moisture Point data found
No TZ grass heigth found
No VR grass heigth found
Tree DBH
| Date | Tag# | Reading (mm) |
|---|---|---|
| 2023-11-13 | 1 | 18.8 |
| 2023-11-13 | 102 | 6.0 |
| 2023-11-13 | 2 | 15.6 |
| 2023-11-13 | 245 | 8.5 |
| 2023-11-13 | 3 | 5.6 |
| 2023-11-13 | 4 | 7.8 |
| 2023-11-13 | 5 | 17.7 |
| 2023-11-13 | 6 | 6.8 |
| 2023-11-13 | 7 | 13.9 |
| 2023-11-13 | 72 | 5.8 |
| 2023-11-13 | 79 | 5.1 |
No water potential data found
No TZ Grass Biomass data found
No TZ OakLeaves Biomass data found
No TZ PineNeedles Biomass data found
2 photos found

20231113TZ_RoadPuddles.jpg ( 2023-11-13 13:47:05 ) Full size: 1440x1920
Puddles in the road that I don’t think we’re there last time
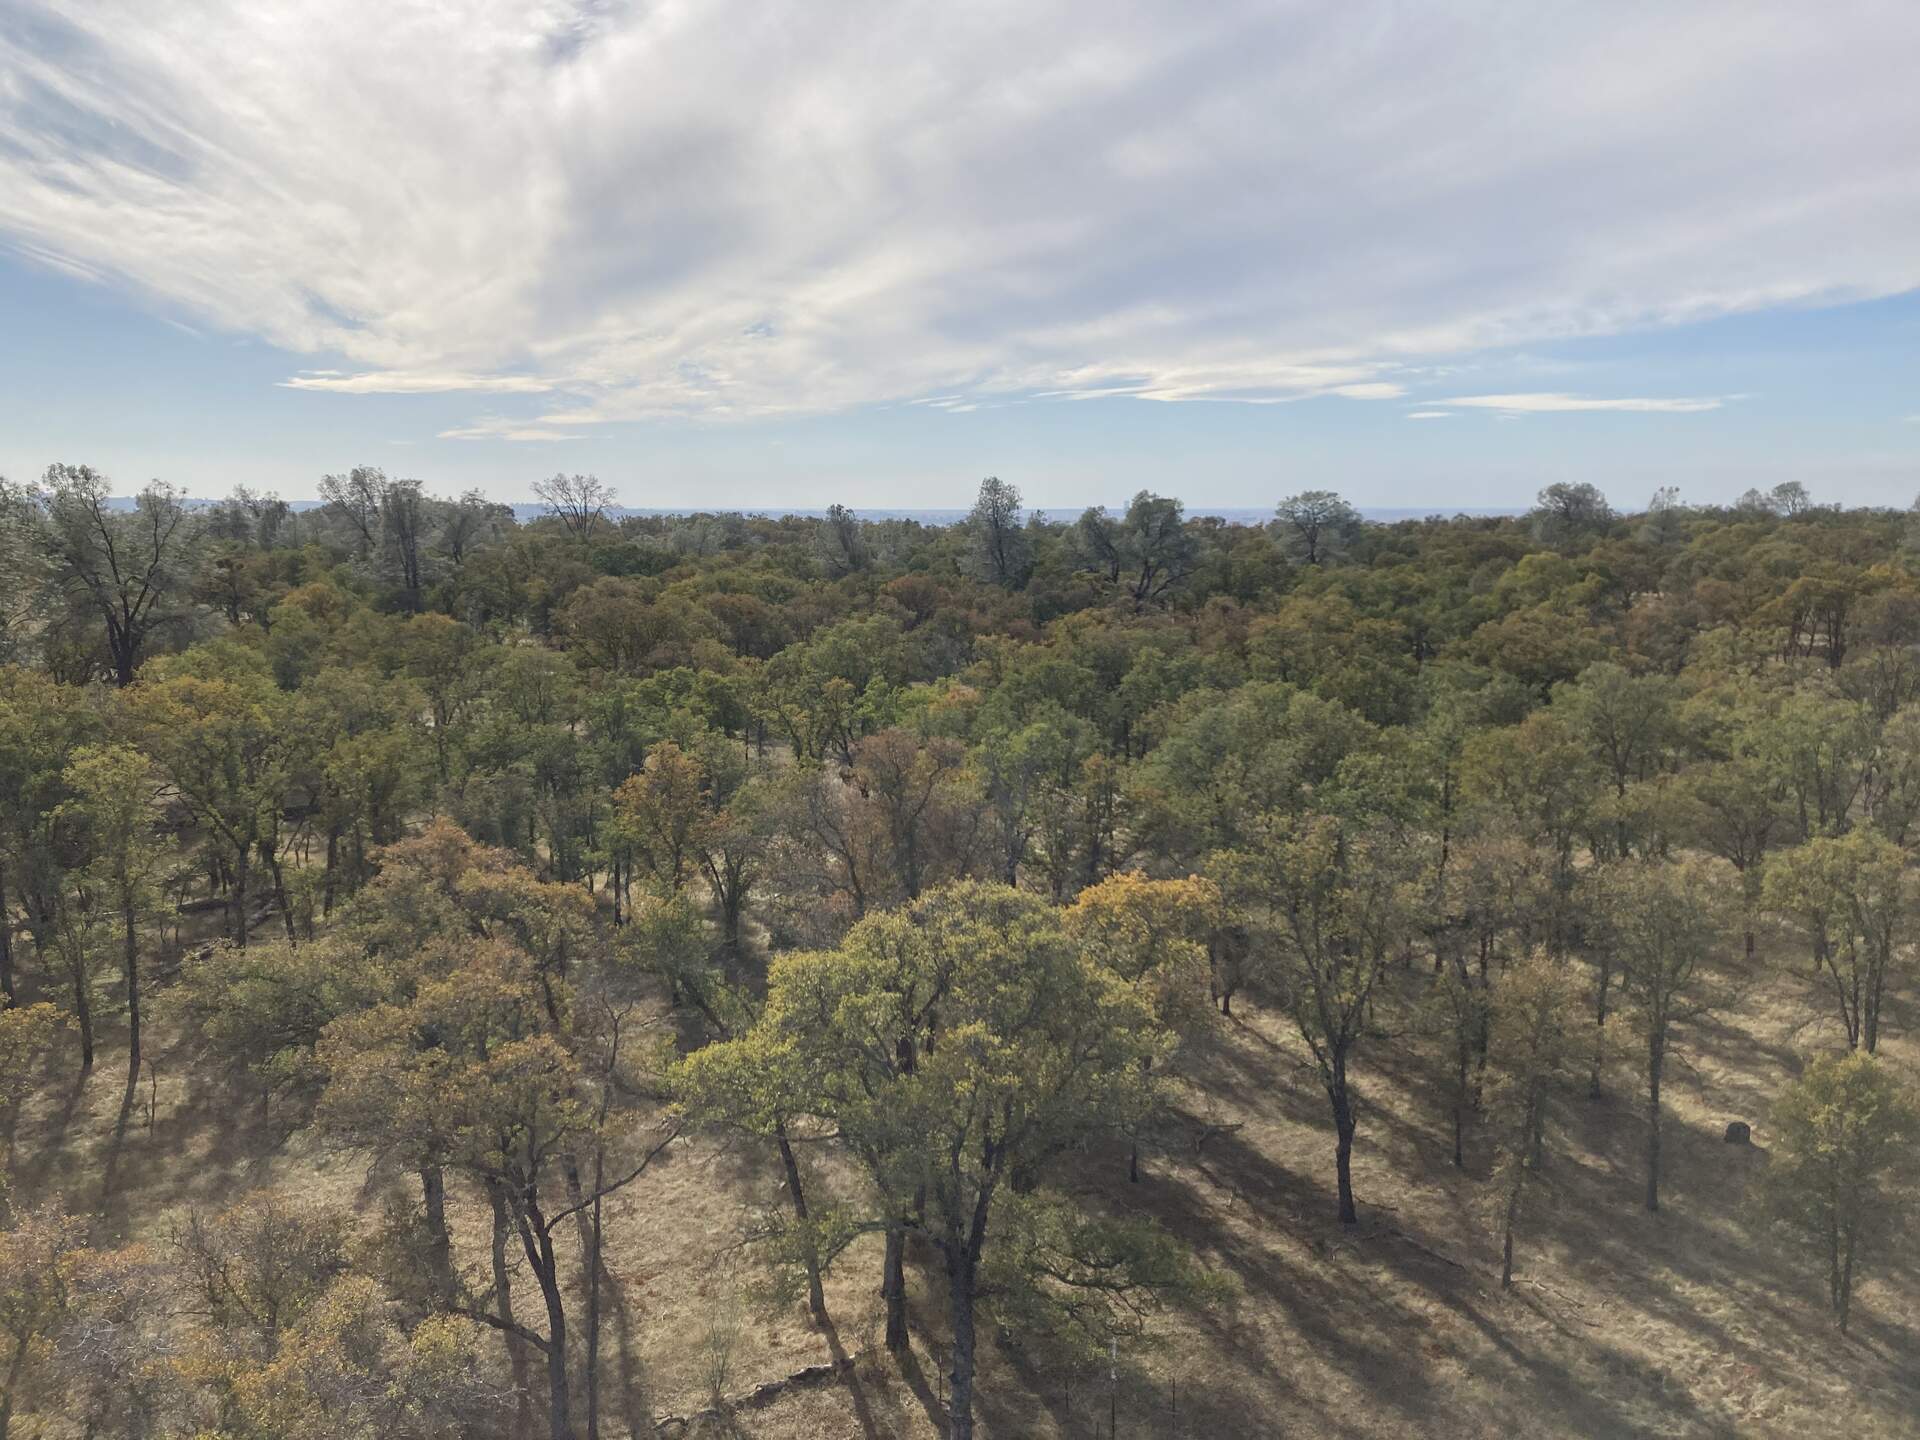
20231113TZ_NiceFallDay.jpg ( 2023-11-13 13:25:44 ) Full size: 1920x1440
Nice fall day
16 sets found
No data found for TZ_Fenergy.
11 TZ_tmet graphs found
No data found for TZ_soilco2.
Can't check TZ_mixed
3 TZ_mixed graphs found
1 TZ_fflux graphs found
8 TZ_fmet graphs found
No data found for TZ_tram.
3 TZ_co2prof graphs found
1 TZ_irt graphs found
No data found for TZ_windprof.
1 TZ_tflux graphs found
8 TZ_sm graphs found
Can't check TZ_met
1 TZ_met graphs found
Can't check TZVR_mixed
8 TZ_osu graphs found
3 TZ_fd graphs found
Tonzi Z-cam data