
Field Notes
<--2023-10-18 11:30:00 | 2023-11-13 11:00:00-->Other sites visited today: Tonzi
Phenocam link: Searching...
Vaira: 2023-11-02 10:30:00 (DOY 306)
Author: Joe Verfaillie
Others: Dennis, Arman, Jo, Owens
Summary: Showing the site to Jo Owens and Arman, the grass has sprouted, staff gauge missing from lowest post at the pond
| Vaira 2023-11-02 Dennis, Arman, Jo Owens and I arrived at about 10:30 PDT. Jo is here from Australia where she works on an eucalyptus savanna site. This is Arman’s first visit to Vaira. It was clear and sunny with a few wispy high clouds. The grass is sprouting! We could see big green patches mostly under the trees driving in but it is pretty wide spread. We got some rain shortly after the last visit that must have kicked things off, but it has been dry since. Maybe some more rain coming in the next week though. Dennis and the others measured the well while I started collecting data. I collected the met, flux, camera and FD data. All seemed well The 7500 read: 430.6ppm CO2, 286.4mmol/m3 H2O, 27.8C, 100.1kPa, 111.7SS Dennis cleaned the radiometers, Arman did the spectral measurements. We went to the pond. The top of the deepest post for the staff gauges is exposed, but the staff gauge seems to have fallen off. If the forecasted rain doesn’t raise the water level too much I can try to find it with waders next time. We left at about 11:40 PDT |
Field Data
No tank data
Well Depth
| Date | Location | Depth (feet) |
|---|---|---|
| 2023-11-02 | VR_well | 60 |
| 2023-11-02 | TZ_floor | 27.1 |
| 2023-11-02 | TZ_road | 37 |
| 2023-11-02 | TZ_tower | 32.8 |
No TZ Moisture Point data found
No VR Moisture Point data found
No TZ grass heigth found
No VR grass heigth found
No VR Tree DBH found
No water potential data found
No VR Grass Biomass data found
No VR OakLeaves Biomass data found
No VR PineNeedles Biomass data found
2 photos found

20231102VR_GreenGrass.jpg ( 2023-11-02 11:10:24 ) Full size: 1440x1920
The grass has sprouted from some rain almost two weeks ago.
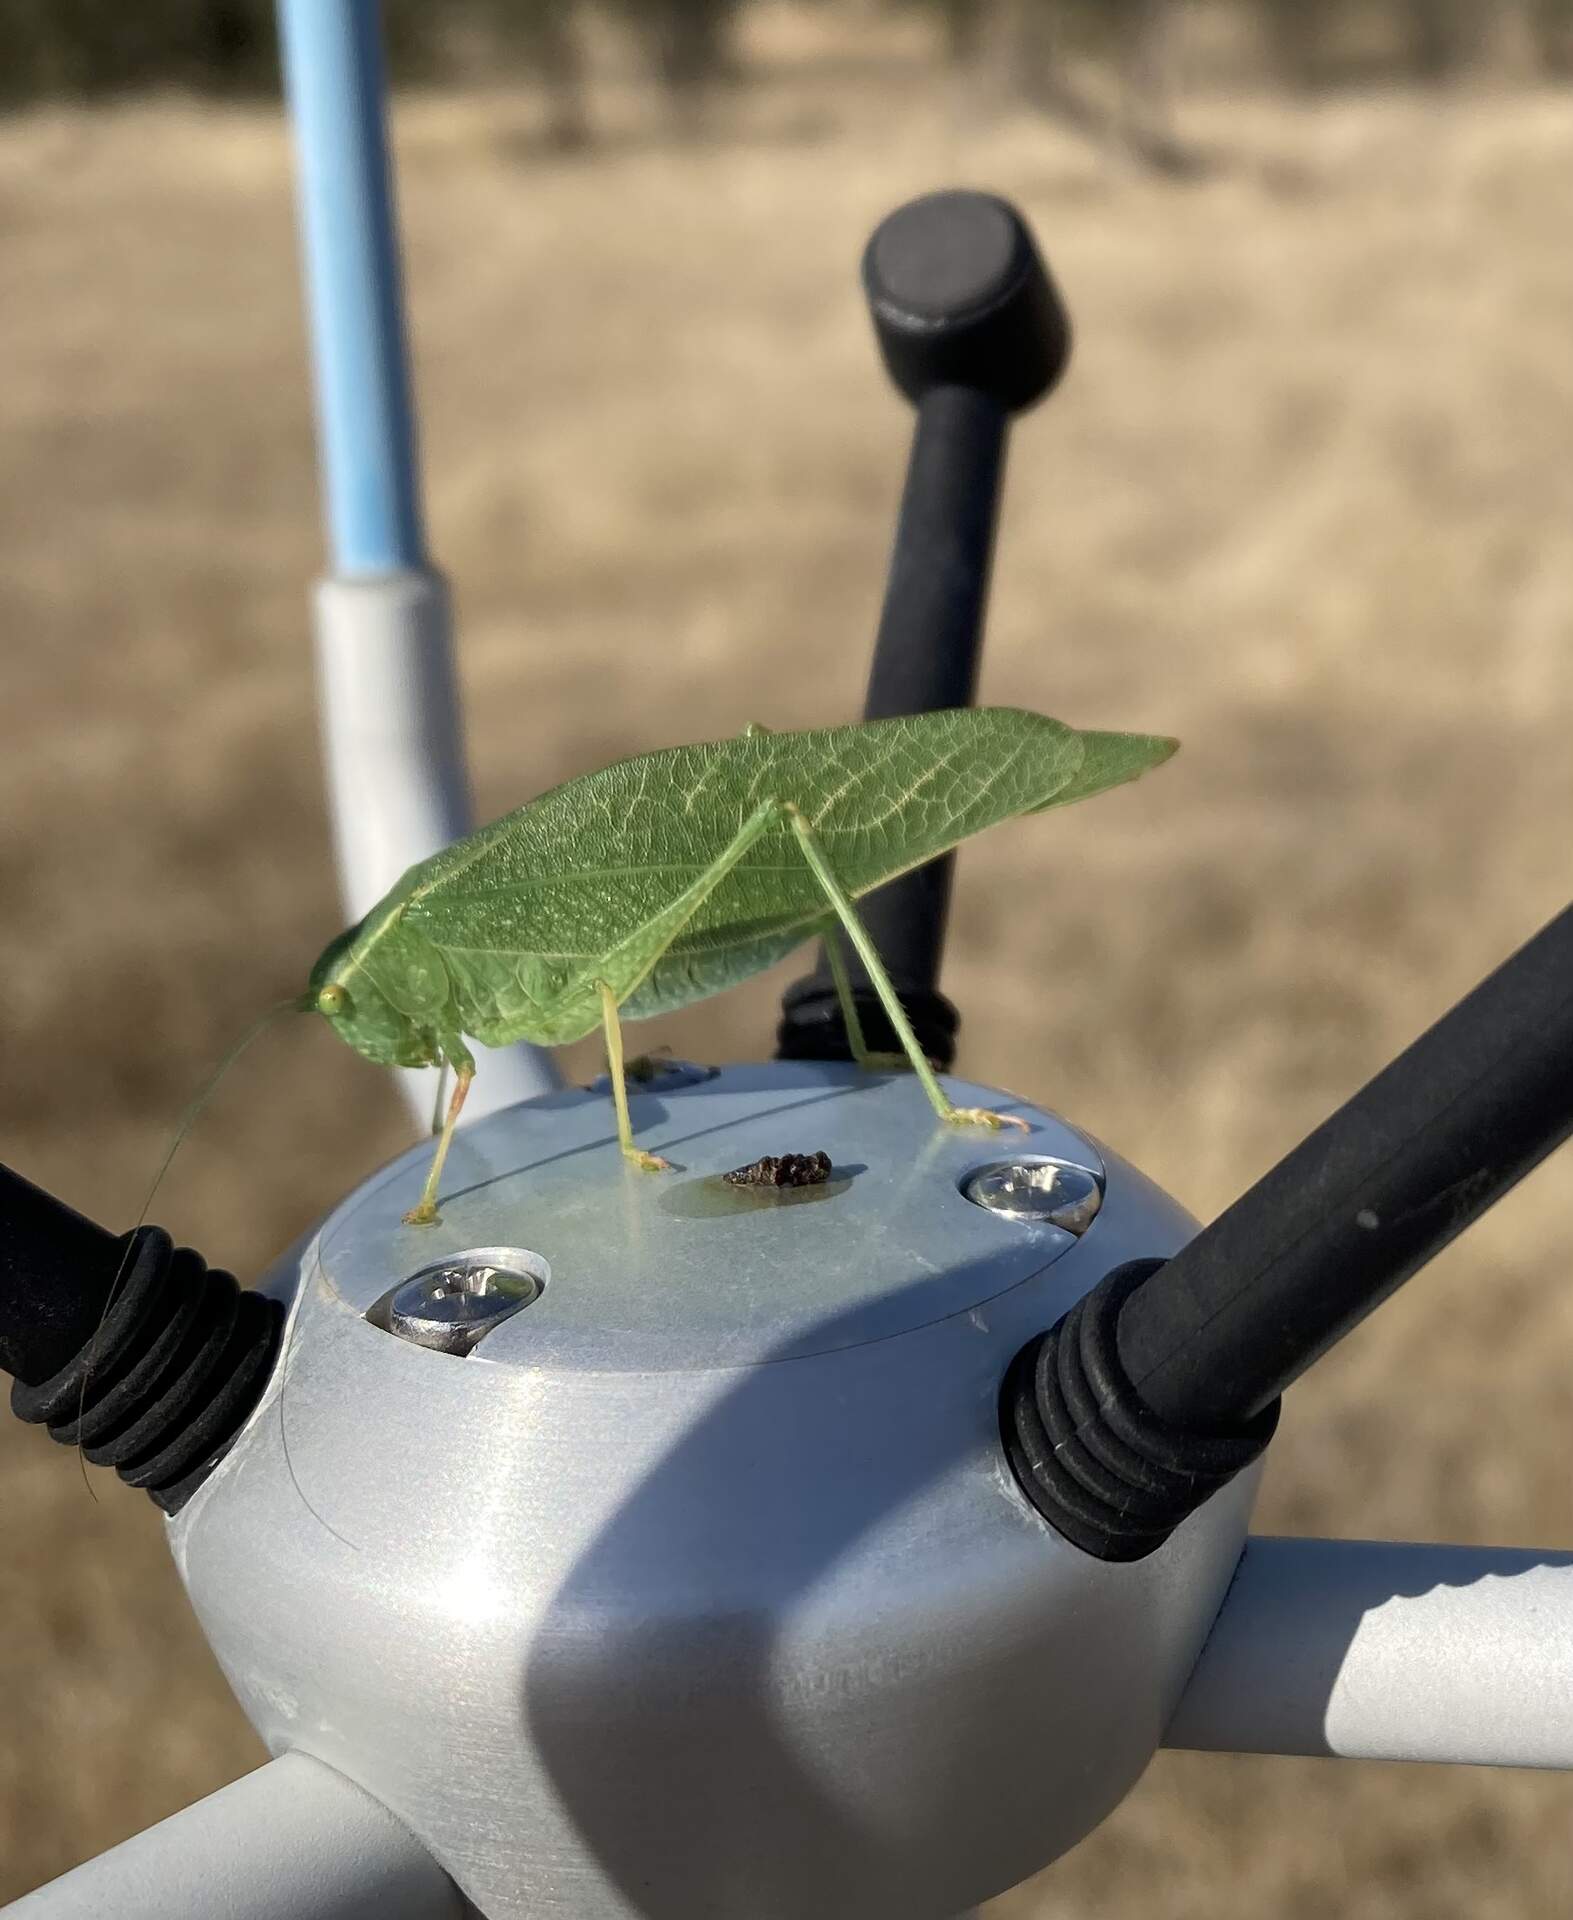
20231102VR_Katydid.jpg ( 2023-11-02 10:50:44 ) Full size: 1573x1920
A Katydid sitting on the sonic
9 sets found
16 VR_met graphs found
2 VR_flux graphs found
No data found for VR_soilco2.
2 VR_pond graphs found
Can't check TZVR_mixed
3 VR_fd graphs found
4 VR_processed graphs found
4 VR_arable graphs found
6 VR_soilvue graphs found