Field Notes
<--2023-09-06 09:55:00 | 2023-09-28 17:20:00-->Other sites visited today: Mayberry | West Pond | East End | Bouldin Corn | Bouldin Alfalfa | Hill Slough
Phenocam link: Searching...
Gilbert Tract: 2023-09-12 10:00:00 (DOY 255)
Author: Daphne Szutu
Others: Joe
Summary: Regular data collection/cleaning, RSB not spinning--fixed maybe, changed camera overlay text, measured sonic heading, FWS here to check on camera traps for nutria
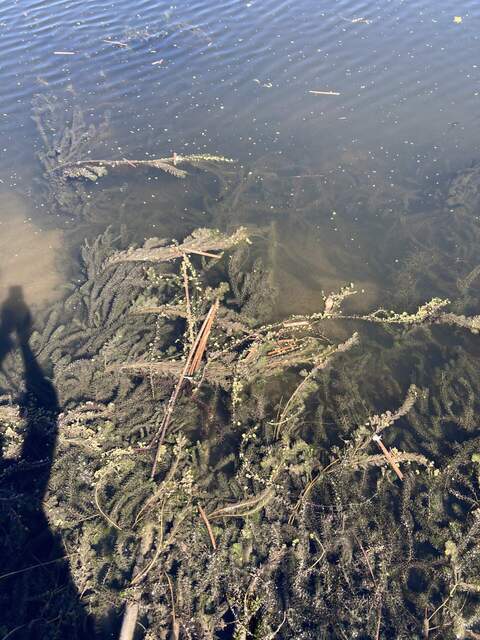
| 2023-09-12 Gilbert Tract Joe and I arrived at 10:00 PDT. It’s only been a week since the last site visit but I will be away all next week. It was warm and sunny with not much breeze. The wetland plants are starting to encroach on the tower. It was near low tide and the staff gauge read 36cm at 9:30 PST. The rotating shadow band was not spinning when we arrived, although it started when Joe opened the PAR enclosure. The motor would change speed when he tugged on the screw terminal. He tried various fixes: swapping the motor, swapping the screw terminal, re-stripping the wires. Not sure if any of the changes are a long-term fix, so I’ll keep an eye on it. Joe cleaned the flux sensors and said the rad sensors were clean. Joe cleaned out the precip bucket. The wash reservoir was full. I downloaded met, cam, and USB GHG data. I changed the eddy clock +45sec around 9:14 PST and restarted logging. I downloaded miniDOT data and changed its desiccant and batteries as part of its ~annual swap. Joe measured the sonic heading with the compass: 66 deg mag N (80 deg true N) The camera photos have been labeled “testcam” since the beginning even though I had updated overlay.conf and the preview photo in StarDot Tools said “gilberttract.” After fussing with the BA camera recently, I realized there was another overlay configuration file, current_overlay.conf. Today I updated current_overlay.conf to change the text from “testcam” to “gilberttract.” I checked the camera card photos before we left and confirmed the new photos have the correct “gilberttract” overlay. The 7500 read: 411ppm CO2, 760mmol/m3 H2O, 22.4C, 101.2kPa, 102--102SS after cleaning The 7700 read: 2.2ppm CH4, 56RSSI – 87 after cleaning The upper boardwalk needs to be replaced. I trimmed some of the spikier upland weeds on the path between the road and the tower. Someone from FWS stopped by to check their camera traps for nutria. They haven’t seen any at Dutch Slough yet but have been capturing some at Sherman. They’ve seen nutria as far north as Grizzly Island and are hoping to stop them there before they keep spreading. If they see nutria from the camera, they will set out live traps. In the worst areas, they can capture 10 nutria a day with the live traps. They kill the nutria and use its pelt as bait in traps. They also take DNA samples. We headed to the channel at 11:10 PDT to download Flo’s data. I downloaded the data and did not get prompted to reset the clock, probably since it’s only been a week since I last connected. The data looked ok, without too many drops. I stopped logging and restarted data collection to make sure the new data is saved in a new file. The water was really clear. We could see the ADCP at the end of its track, weeds to the left and right and a bare patch directly in front where the concrete panels are. Joe raked out a bunch of the weeds. We left at 11:25 PDT. |
1 photos found

20230912GT_ADCP.jpg ( 2023-09-12 11:11:23 ) Full size: 1440x1920
The ADCP can just be seen at the end of its track
8 sets found
Can't check MBWPEESWGT_mixed
Can't check MBEEWPSWEPGT_cam
16 GT_met graphs found
4 GT_flux graphs found
3 GT_adcp graphs found
1 GT_cam graphs found
2 GT_usgs graphs found
No data found for GT_chanexo.

