
Field Notes
<--2023-06-15 12:00:00 | 2023-07-11 11:05:00-->Other sites visited today: East End | Bouldin Corn | Bouldin Alfalfa
Phenocam link: Searching...
West Pond: 2023-06-28 09:50:00 (DOY 179)
Author: Daphne Szutu
Others: Robert, Cliff
Summary: Regular data collection/cleaning, Cliff taking bulk soil samples, NDVI no data--fixed, web-spinning spider mites on willows!
| 2023-06-28 West Pond Robert and I arrived at 9:50 PDT and met with Cliff Bueno de Mesquita from LBL. He was here to sample bulk soil from West Pond for an artificial seawater addition experiment at Duke led by Emily Bernhardt. He already sampled Mayberry earlier today. He walked around to the north edge of West Pond and sampled 1.5L of soils off of the outlet berm. Cliff is working on a paper with Wyatt. Since we have an orphan data file from JGI with unclear headers “"JGI SF salinity soils data for UCB.xlsx", Cliff said I could send it to him so he could ask Wyatt about the headers. He told us Wyatt’s protocol is that d1=0-5cm and d2=5-15cm. While we were all chatting by the outlet berm, we noticed the willow trees in that area were covered with a white fuzzy material. At first we thought it was cattail fluff stuck in spiderwebs, but upon closer inspection it was like stretched-out cotton stuffing. There were small lumps (egg sacs?) distributed throughout the fuzz. The trees and branches were totally covered, almost like wind-blown icicles after a storm. We saw some ladybugs and other flying insects fluttering around the fuzz. Robert suggested they were web-spinning spider mites. It was a mild morning and sunny with a slight breeze. The water inlet was on when we drove by and the staff gauge read 59cm. I downloaded met, cam, and USB GHG data. I changed the eddy clock +45sec around 9:02 PST to match the laptop time and restarted logging. Robert cleaned flux and rad sensors. The wash reservoir was pretty much full. NDVI data has been NAN for the past 2 weeks. I power cycled both sensors, and data seemed fine ok. Otherwise, the data looks complete so our power fix is working. The 7500 read: 410ppm CO2, 640mmol/m3 H2O, 21.2C, 101.1kPa, 99SS--101 after cleaning The 7700 read: 2.0ppm CH4, 53RSSI--90 after cleaning We left at 10:30 PDT. Cliff headed home and Robert and I went on to East End. |
2 photos found
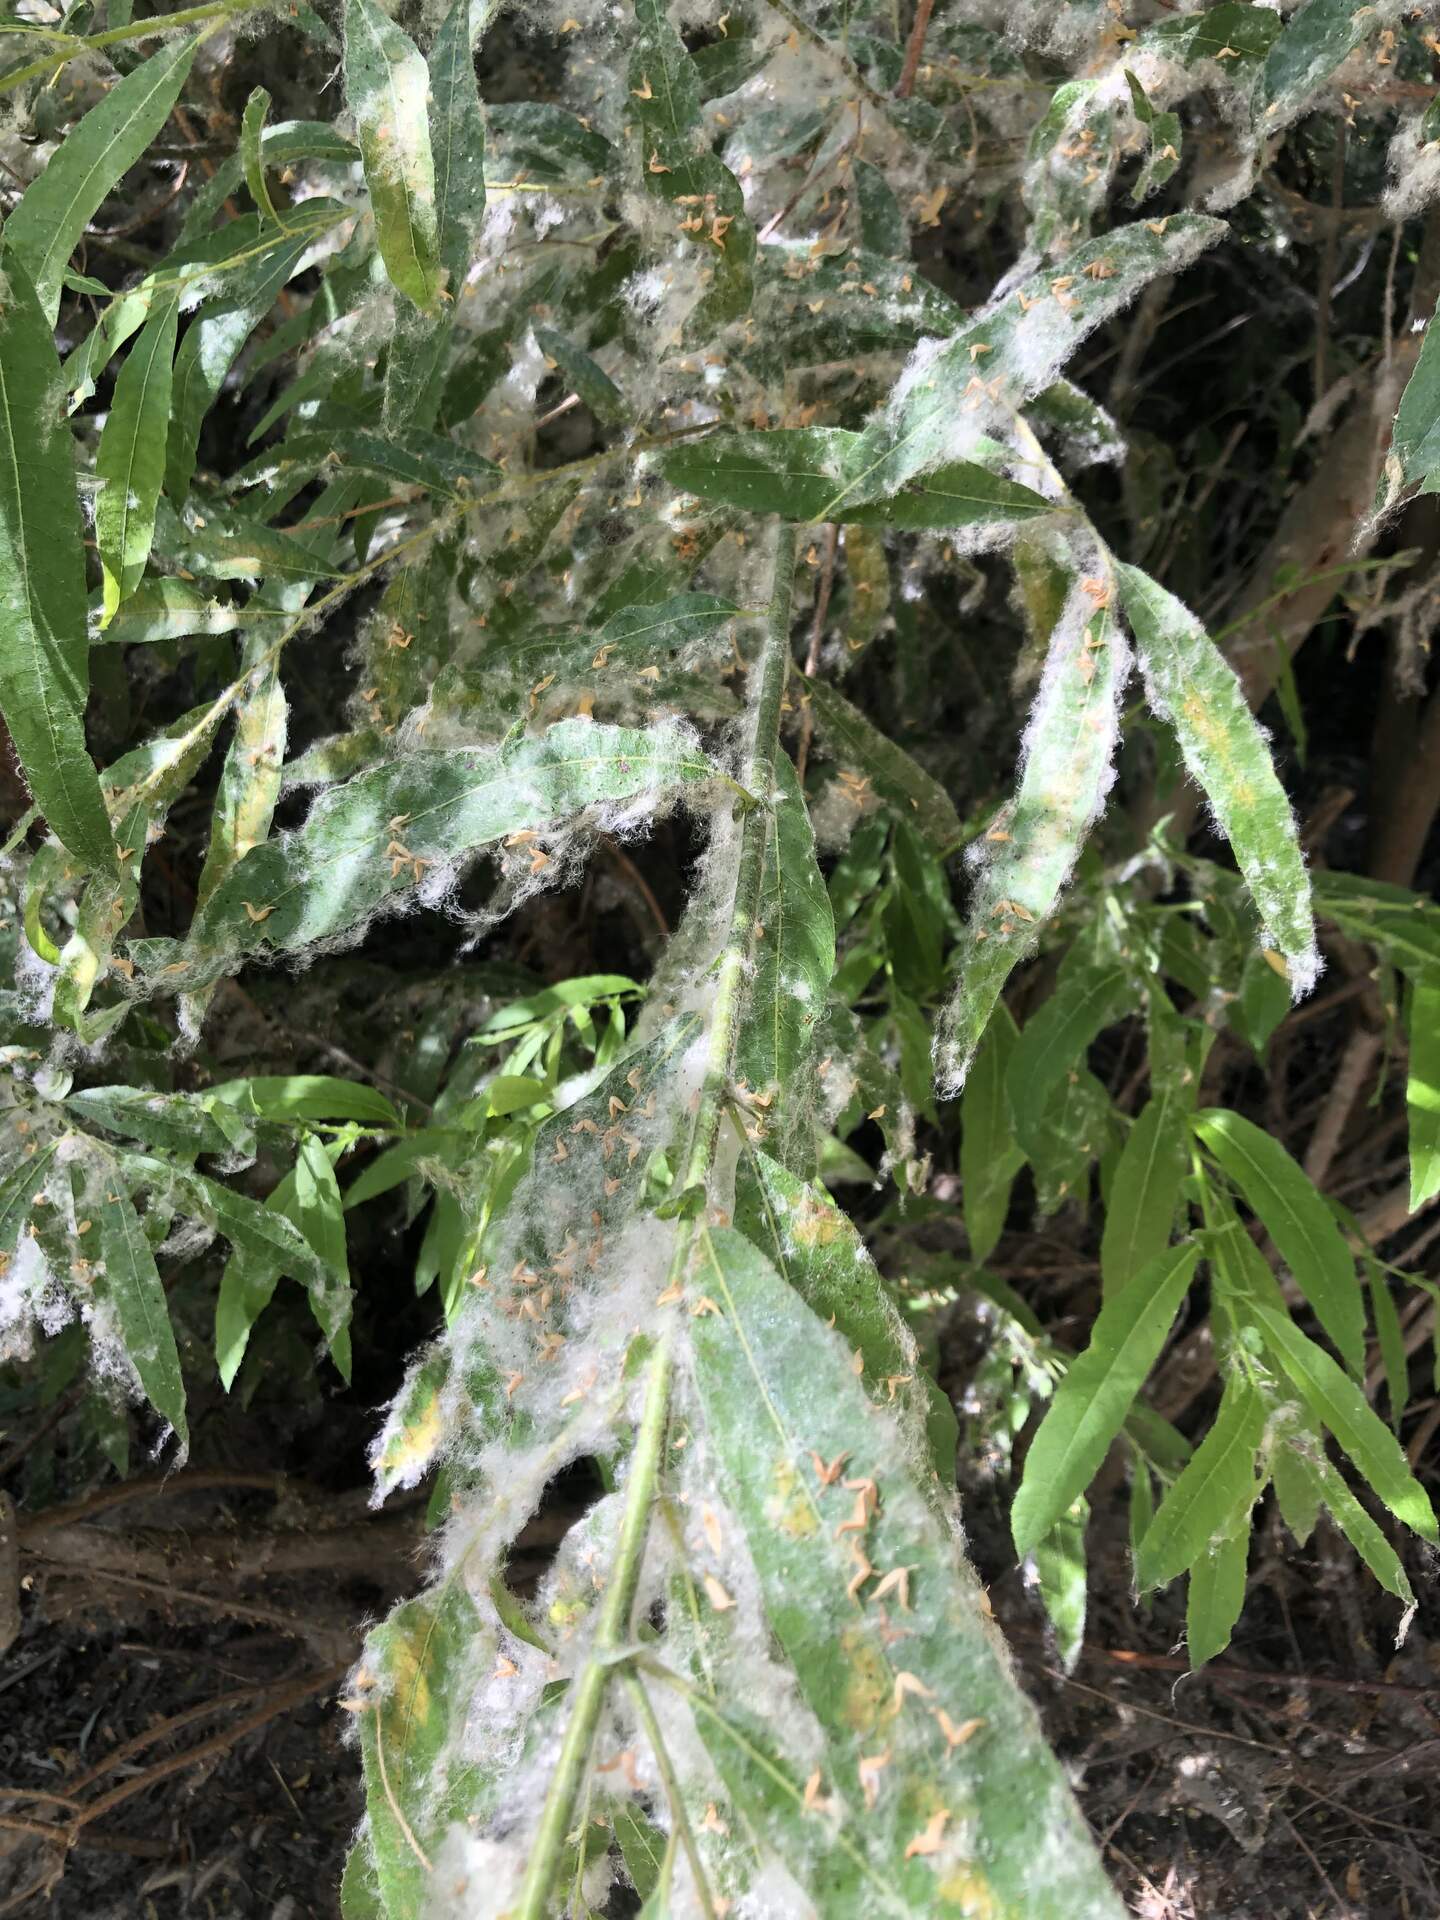
20230628WP_SpiderMites.jpg ( 2023-06-28 10:20:53 ) Full size: 1440x1920
Lots of fuzzy white substance on the willow trees. At first glance we thought it was cattail fluff stuck in spider webs, but might be spider mites.

20230628WP_SpiderMites2.jpg ( 2023-06-28 10:19:18 ) Full size: 1440x1920
Lots of fuzzy white substance on the willow trees. At first glance we thought it was cattail fluff stuck in spider webs, but might be spider mites.
8 sets found
Can't check WP_DO
1 WP_DO graphs found
14 WP_met graphs found
5 WP_flux graphs found
Can't check MBWPEESWGT_mixed
Can't check MBEEWPSWEPGT_cam
Can't check MBSWEEWPBCBA
1 WP_processed graphs found
4 WP_arable graphs found