
Field Notes
<--2023-06-14 13:50:00 | 2023-07-11 13:55:00-->Other sites visited today: West Pond | East End | Bouldin Corn
Phenocam link: Searching...
Bouldin Alfalfa: 2023-06-28 13:00:00 (DOY 179)
Author: Daphne Szutu
Others: Robert
Summary: Bales on field, spectral measurements weird, CR1000 program update - added more stats for modified Bowen ratio
| 2023-06-28 Bouldin Alfalfa Robert and I arrived at 13:00 PDT. It was sunny and clear, warm but with a cooling breeze. There are bales on our field and a tractor was picking up bales on the field to our east when we arrived and had just started picking up bales on our field as we were leaving. Robert took spectral and veg height measurements. I downloaded all of the usual data: met, cam, USB GHG, FD, and IRT. After downloading data, I updated the CR1000 code to include the qsat and q equations for the modified Bowen ratio calculations. The program is now saving average and standard deviation of q. I had trouble connecting to the 7550 at first because the unit never showed up in the winGHG software. The 7550 ethernet cable is connected to a switch, and I was trying to connect to the switch. Finally I was able to connect by unplugging the 7550 ethernet cable from the switch and plugging it into my USB-ethernet dongle. I changed the eddy clock +45sec to match the laptop time from 12:22 to 12:22:45 and restarted logging afterwards. Robert cleaned flux and met sensors. We cleaned off the undercanopy PAR sensor which had some hay on top. The 7500 read: 404ppm CO2, 601mmol/m3 H2O, 26.3C, 101.0kPa, 93SS – 98.5 after cleaning We left at 13:35 PDT and made a quick stop back at BC to swap the camera card before heading home. |
Next Mowing: 2023-07-18
Veg Height (cm): Tape measure from ground to top of plant
20, 29, 13, 35, 22, 45, 25, 39, 28, 43, avg = 29.9, stdev = 10.45
1 photos found
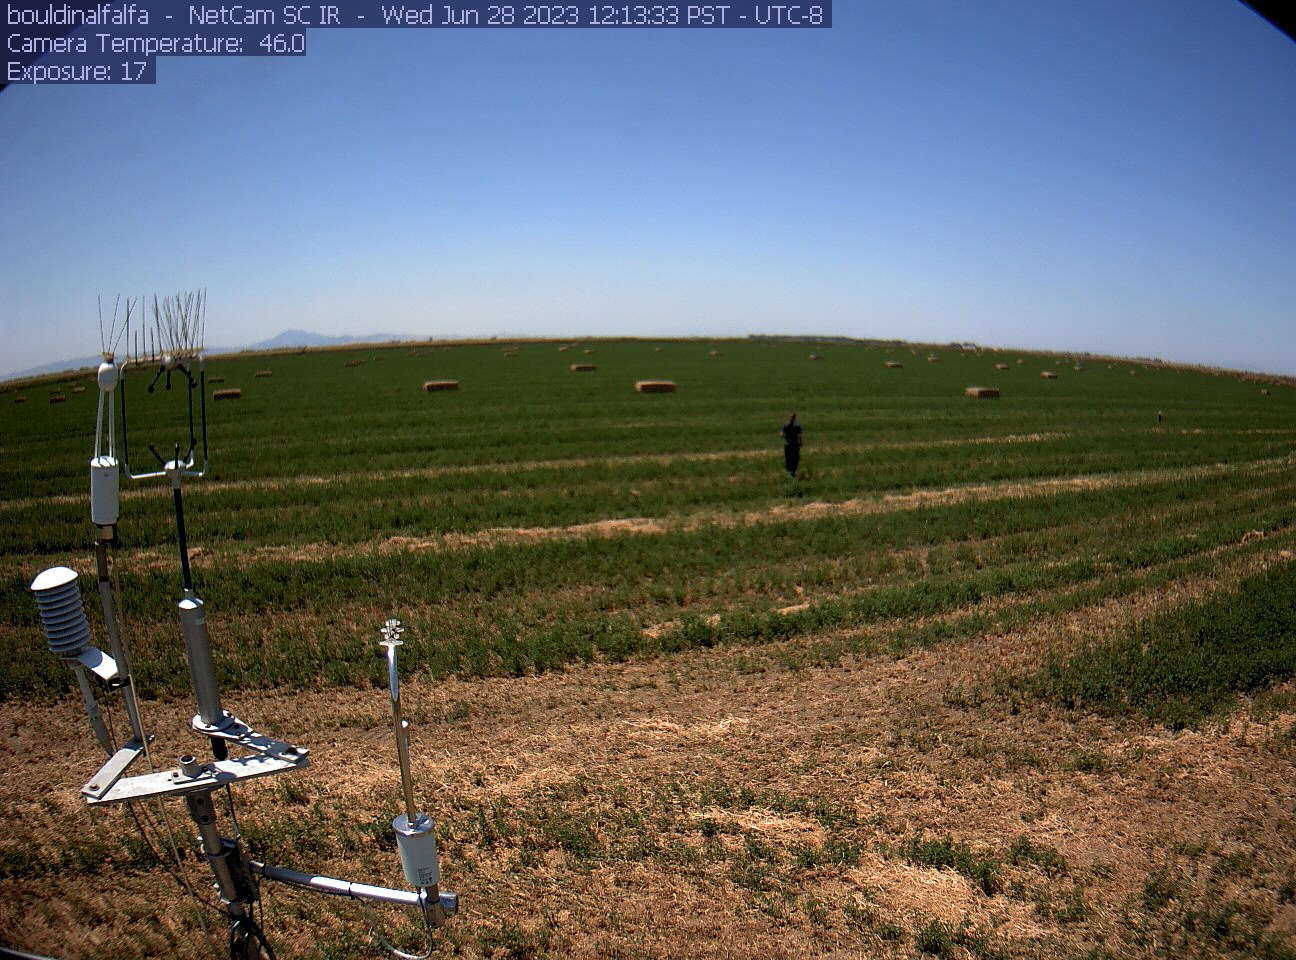
bouldinalfalfa_2023_06_28_121333.jpg ( 2023-06-28 20:15:28 ) Full size: 1296x960
Fieldwork and bales on the field
7 sets found
4 BA_flux graphs found
21 BA_met graphs found
6 BA_arable graphs found
Can't check TATWBABCSB_cam
Can't check MBSWEEWPBCBA
2 BA_processed graphs found
No data found for BA_adex.