
Field Notes
<--2023-05-30 11:30:00 | 2023-07-06 11:20:00-->Other sites visited today: Tonzi
Phenocam link: Searching...
Vaira: 2023-06-16 09:30:00 (DOY 167)
Author: Joe Verfaillie
Others: Daphne
Summary: Grasses are about done, standard fieldwork, swapped 7500 for calibration.
| Vaira 2023-06-16 Daphne and I arrived at about 9:30 PDT. It was clear, sunny and warm with a cool breeze from the southwest. There is still a bit of green in the low spots. The rest of the grass is all yellow but not crispy yet. There was still some water in the stream from the pond and the water hole is better than half full. Daphne did most of the work, refreshing her memory on what needs to be done while I’m away for the next six weeks. She measured the well and collected the Flux, Met, Camera and FD data. We swapped the 7500 for calibration sn 75H-2514 came off and sn 1594 went on. 2514 read: 411.7ppm CO2, 723.6mmol/m3 H2O, 25.6C, 99.2kPa, 96.3SS 1594 read: 427.7ppm CO2, 584.4mmol/m3 H2O, 25.4C, 99.3kPa, 101.8SS We set the pressure coefficients, adjusted the clock by about +2:30min and reset the box. The difference in the CO2 and H2O reading is probably due to the existing 7500 being a little dirty. I did spectral measurements. The grass is not going to change much soon so monthly spectra is probably fine. We went to the pond and collected the data. We left at about 10:30 PDT |
Field Data
No tank data
Well Depth
| Date | Location | Depth (feet) |
|---|---|---|
| 2023-06-16 | TZ_tower | 21.55 |
| 2023-06-16 | TZ_floor | 16.86 |
| 2023-06-16 | TZ_road | 26.29 |
| 2023-06-16 | VR_well | 50.81 |
| 2023-06-16 | VR_pond | 17.76 |
No TZ Moisture Point data found
No VR Moisture Point data found
No TZ grass heigth found
No VR grass heigth found
No VR Tree DBH found
No water potential data found
No VR Grass Biomass data found
No VR OakLeaves Biomass data found
No VR PineNeedles Biomass data found
1 photos found
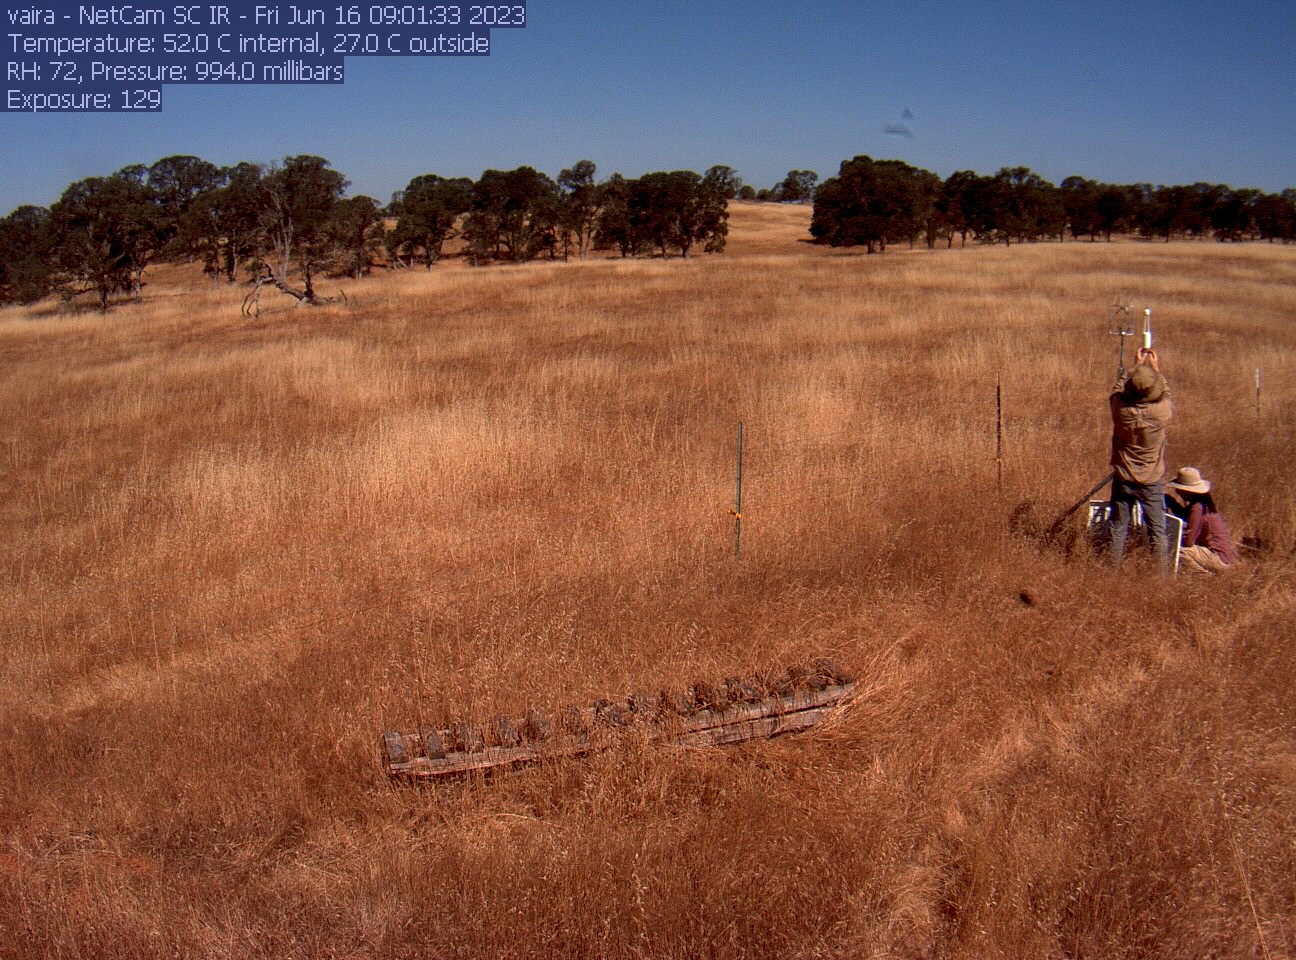
vaira_2023_06_16_090130.jpg ( 2023-06-16 17:02:14 ) Full size: 1296x960
Joe and Daphne on site
9 sets found
16 VR_met graphs found
2 VR_flux graphs found
No data found for VR_soilco2.
2 VR_pond graphs found
Can't check TZVR_mixed
3 VR_fd graphs found
4 VR_processed graphs found
4 VR_arable graphs found
6 VR_soilvue graphs found