Field Notes
<--2023-05-16 10:50:00 | 2023-06-16 09:30:00-->Other sites visited today: Tonzi
Phenocam link: Searching...
Vaira: 2023-05-30 11:30:00 (DOY 150)
Author: Joe Verfaillie
Others: Dennis, Ngoc Nguyen
Summary: Standard data collection, end-of-season biomass samples, cool for this time of year.
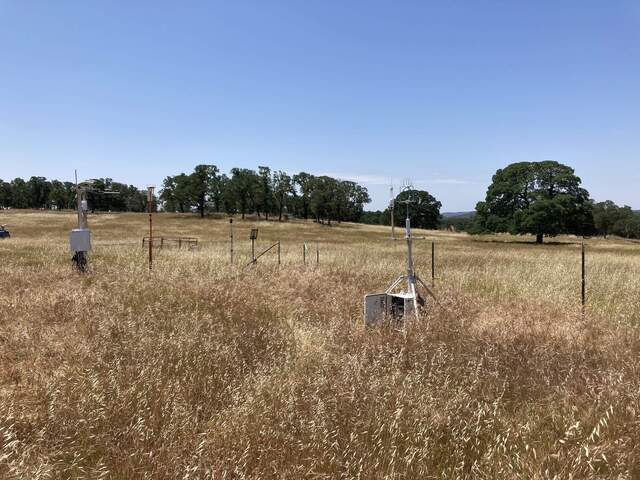
| Vaira 2023-05-30 Dennis, Ngoc Nguyen and I arrived at about 11:30 PDT. It was clear sunny and unusually cool for this time of year with a nice breeze from the west. There is still some green grass and flowers in the low spots but mostly the grass is yellow and has all gone to seed – lots of stickers in your socks. The trees look green and full of leaves. Dennis measured the well and then helped Ngoc take five end-of-season biomass samples. Looks like the Davis crew recently took three biomass samples from inside their fence too. Dennis also did veg height but it is very patchy - mostly about thigh to waist high but some of the longest seed stalks almost shoulder high and other spots much shorter. I collected the flux, met, camera and FD data. All looked well. I cleaned a bunch of spider webs off the eddy sensors. The 7500 read: 420.1ppm CO2, 533.7mmol/m3 H2O, 25.2C, 99.2kPa, 100.5SS I also did spectral measurements and cleaned the radiometers which were pretty clean already. We went to the pond and skipped some stones. All seemed well there. We left at about 12:30 PDT |
Field Data
No tank data
Well Depth
| Date | Location | Depth (feet) |
|---|---|---|
| 2023-05-30 | VR_well | 49.1 |
| 2023-05-30 | VR_pond | 18.74 |
| 2023-05-30 | TZ_floor | 15.7 |
| 2023-05-30 | TZ_road | 25.1 |
| 2023-05-30 | TZ_tower | 20.2 |
No TZ Moisture Point data found
No VR Moisture Point data found
No TZ grass heigth found
Grass Height VR 20
| Date | Height reps (cm) | Location | Average | Samp | STDEV | |||||||||||||||||||
|---|---|---|---|---|---|---|---|---|---|---|---|---|---|---|---|---|---|---|---|---|---|---|---|---|
| 2023-05-30 | 45 | 51 | 57 | 39 | 36 | 33 | 50 | 42 | 43 | 31 | 26 | 35 | 44 | 24 | 23 | 39 | 32 | 67 | 29 | 39 | GH_ALL | 39.25 | 20 | 10.91 |
No VR Tree DBH found
No water potential data found
No VR Grass Biomass data found
No VR OakLeaves Biomass data found
No VR PineNeedles Biomass data found
1 photos found

20230530VR_GrassTreesSky.jpg ( 2023-05-30 11:50:33 ) Full size: 1920x1440
Grass gas gone to seed, Trees look good clear skies
9 sets found
16 VR_met graphs found
2 VR_flux graphs found
No data found for VR_soilco2.
2 VR_pond graphs found
Can't check TZVR_mixed
3 VR_fd graphs found
4 VR_processed graphs found
4 VR_arable graphs found
6 VR_soilvue graphs found

