
Field Notes
<--2023-05-30 12:40:00 | 2023-07-06 12:15:00-->Other sites visited today: Vaira
Phenocam link: Searching...
Tonzi: 2023-06-16 10:45:00 (DOY 167)
Author: Joe Verfaillie
Others: Daphne
Summary: Grasses about done, swapped 7500s for calibration, added Arduino RSB diffuse PAR to Tower top for inter-comparison, performance checks on FD chambers, fixed malfunctioning Tree #4 point dendrometer.
| Tonzi 2023-06-16 Daphne and I arrived at about 10:45 PDT. It was clear hot and sunny with a variable breeze. Still a tinge of green here and some flowers but some of the herbs in the open sunny areas are getting crispy. The trees look good. Daphne is refreshing her memory on what needs doing so she can do it while I’m away the next six weeks. We climbed the Tower to collect data, swap the 7500 and install the new Arduino based rotating shadow band for testing. Daphne lowered the eddy post and 7500 sn 75H-2667 came off and sn 0042 went on. 2667 read: 409.4ppm CO2, 664.1mmol/m3 H2O, 24.2C, 98.7kPa, 100.8SS 0042 read: 425.0ppm CO2, 590.1mmol/m3 H2O, 24.3C, 98.8kPa, 101.5SS We updated the pressure coefficients, adjusted the clock by +45sec and reset the box. The difference in the readings is probably due to the existing 7500 being a little dirty. I added the RSB to the railing with ¼-20 U-bolts, and Daphne wired it into the 12V power. CR1000 sn 4190 and PAR sn 010164 were running. We will inter-compare with the BF5 for two or three weeks. Back on the ground I did the Moisture Point measurements and midday water potential. Two or three of the Moisture Point probes (under, 4, A) are misbehaving again now that the soils are getting dry. We also checked on Point Dendrometer #4 that Mukund said was not working. Visually I didn’t see any problems but unplugging and replugging the stereo jack seem to fix it. I downloaded the data just before we left and there were two new readings that seem in the correct range. Daphne swapped the 7500 on the Floor tower for calibration: sn 75H-2182 came off and sn 0073 went on. 2182 read: 421.0ppm CO2, 602.1mmol/m3 H2O, 30.2C, 98.9kPa, 95.6SS 0073 read: 430.7ppm CO2, 531.2mmol/m3 H2O, 29.5C, 98.9kPa, 100.8 The pressure coefficients were updated, the clock adjusted by +1:30min and the box rest. She also measured the wells, serviced the zcam and read the dendrometers north of the road. Then she worked on collecting the FD data and doing performance checks on both chambers to bring their CO2 reading back into a reasonable range. Make sure to reset the CO2 value before exporting the report – otherwise you have to start over! The Open FD was adjusted from 640ppm to 400ppm, the Tree1 FD was adjusted from -125ppm to 400ppm. Offsets in the concentrations should not affect the fluxes which are calculated from relative values. I read the rest of the dendrometers, serviced the two z-cams and measured the Tower well while Daphne worked on the FD chambers. We left at about 14:15 PDT |
Field Data
No tank data
Well Depth
| Date | Location | Depth (feet) |
|---|---|---|
| 2023-06-16 | TZ_tower | 21.55 |
| 2023-06-16 | TZ_floor | 16.86 |
| 2023-06-16 | TZ_road | 26.29 |
| 2023-06-16 | VR_well | 50.81 |
| 2023-06-16 | VR_pond | 17.76 |
No TZ Moisture Point data found
No VR Moisture Point data found
No TZ grass heigth found
No VR grass heigth found
Tree DBH
| Date | Tag# | Reading (mm) |
|---|---|---|
| 2023-06-16 | 1 | 15.7 |
| 2023-06-16 | 102 | 3.9 |
| 2023-06-16 | 2 | 11.3 |
| 2023-06-16 | 245 | 7.8 |
| 2023-06-16 | 3 | 5.2 |
| 2023-06-16 | 4 | 6.9 |
| 2023-06-16 | 5 | 15.4 |
| 2023-06-16 | 6 | 5.8 |
| 2023-06-16 | 7 | 13.7 |
| 2023-06-16 | 72 | 21.4 |
| 2023-06-16 | 79 | 20.0 |
Water Potential - mode: raw
| Time | Species | Tree | readings (bar) | ||
|---|---|---|---|---|---|
| 2023-06-16 12:40:00 | OAK | 102 | -18 | -31 | -24 |
| 2023-06-16 12:40:00 | OAK | 92 | -30 | -32 | -34 |
No TZ Grass Biomass data found
No TZ OakLeaves Biomass data found
No TZ PineNeedles Biomass data found
2 photos found
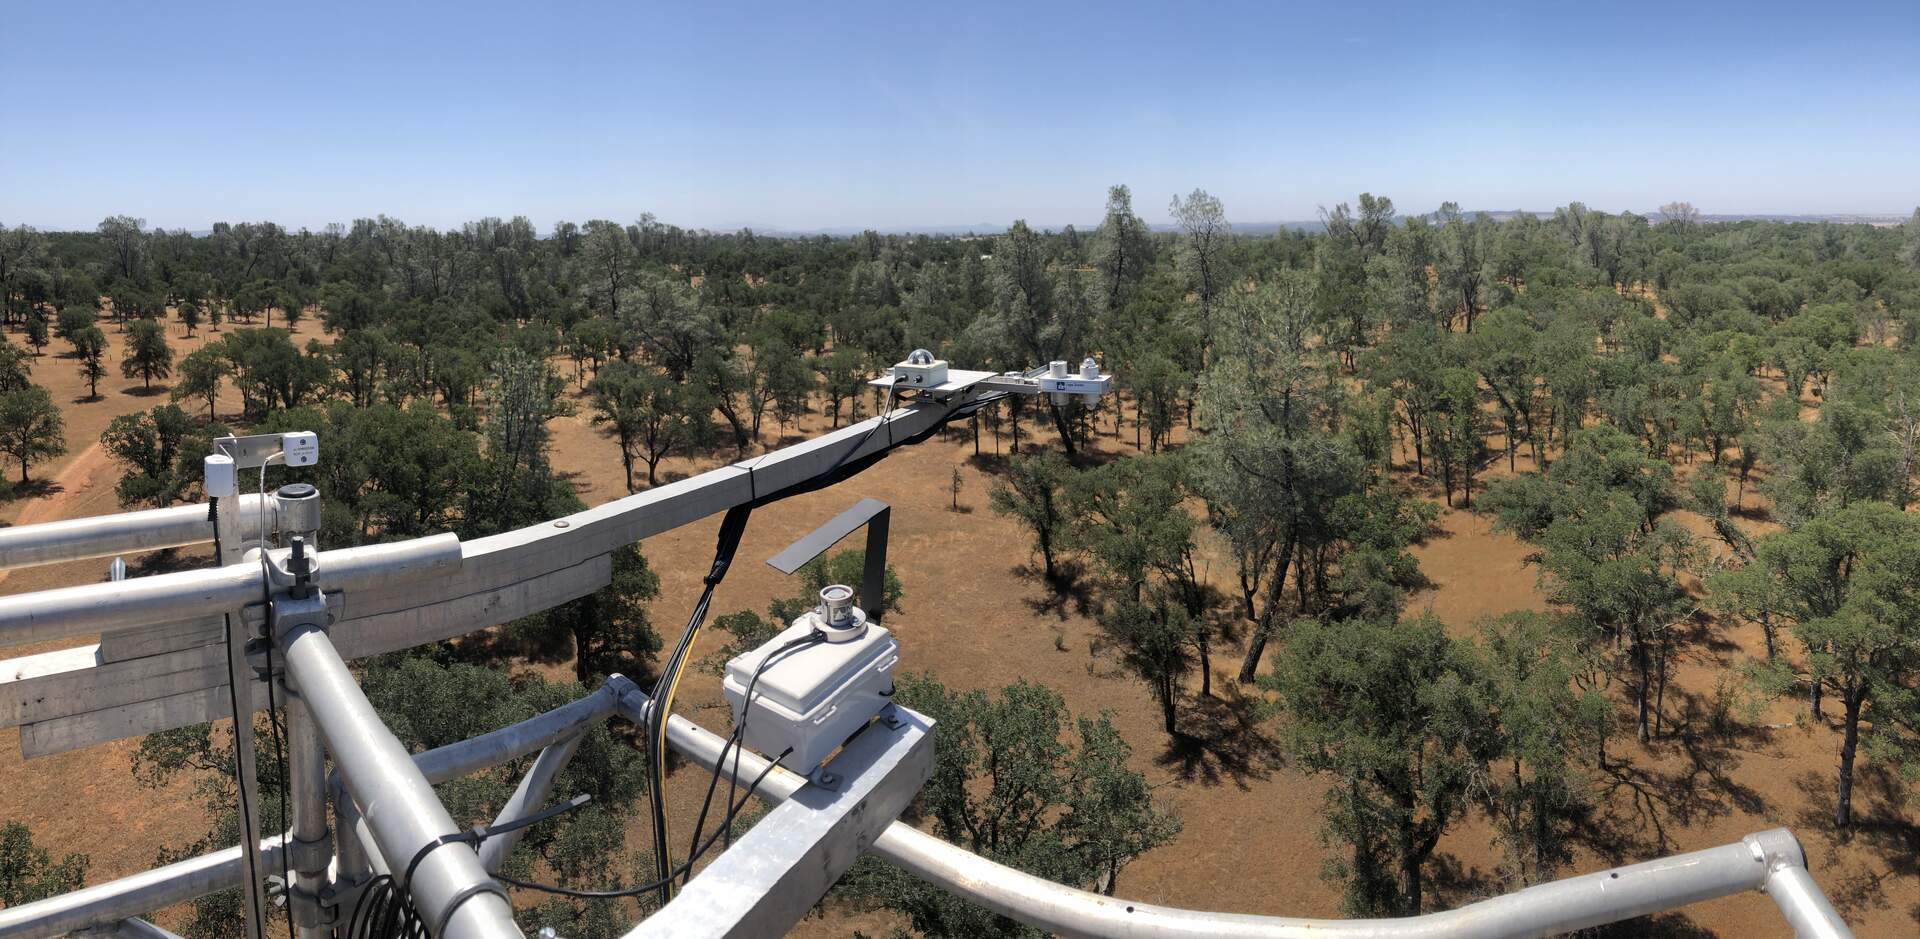
20230616TZ_RotatingShadowBand.jpg ( 2023-06-16 11:36:54 ) Full size: 1920x939
Rotating shadow band set up on the top of Tonzi tower for an intercomparison with the Delta-T BF5 diffuse PAR sensor

20230616TZ_WoodpeckerHoles.jpg ( 2023-06-16 13:43:10 ) Full size: 1440x1920
Woodpecker nest holes in the trunk of the blue oak tree
16 sets found
No data found for TZ_Fenergy.
11 TZ_tmet graphs found
No data found for TZ_soilco2.
Can't check TZ_mixed
3 TZ_mixed graphs found
1 TZ_fflux graphs found
8 TZ_fmet graphs found
No data found for TZ_tram.
3 TZ_co2prof graphs found
1 TZ_irt graphs found
No data found for TZ_windprof.
1 TZ_tflux graphs found
8 TZ_sm graphs found
Can't check TZ_met
1 TZ_met graphs found
Can't check TZVR_mixed
8 TZ_osu graphs found
3 TZ_fd graphs found
Tonzi Z-cam data