Field Notes
<--2023-06-16 09:30:00 | 2023-07-25 08:30:00-->Other sites visited today: Tonzi
Phenocam link: Searching...
Vaira: 2023-07-06 11:20:00 (DOY 187)
Author: Daphne Szutu
Others: Dennis, Ngoc
Summary: Regular data collection/cleaning, raised eddy sensors, first heat wave last weekend
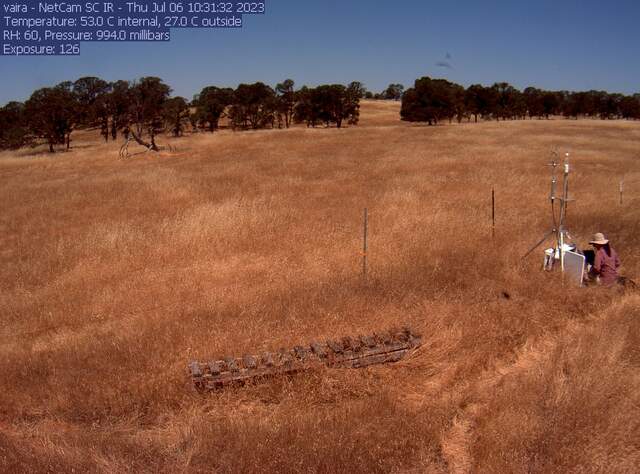
| 2023-07-06 Vaira Dennis, Ngoc, and I arrived around 11:20 PDT. We stopped at the USGS office in Davis to drop off fDOM calibration solution on the way here, so it was a little later than usual. We are doing regular data collection while Joe is in Japan. It was sunny, warm, and still. The watering hole was still half full. There was a short heatwave last weekend where temperature were above 40C for 2 days. The trees still look nice and green. I downloaded met, cam, and USB GHG data. I downloaded data from both FD chambers and cleared their memories. I changed the eddy clock +45sec from 10:34:15 to 10:35:00 PST to match the laptop time and restarted logging afterwards. The 7500 read: 421ppm CO2, 544mmol/m3 H2O, 28.9C, 99.3kPa, 100.4SS Dennis measured the well water level and cleaned the radiometer sensors, which he said weren’t too dirty. He noted that the Delta-T BF3 dfPAR dome was missing its weatherstripping and should be decommissioned before the rainy season. Dennis wanted to raise the eddy flux post to reduce spectral interference from the enclosures directly below the eddy sensors. The sensors were raised 19cm. Ground to top surface of sonic arm = 135cm before, 154cm after The sonic orientation was 21 deg true N both before and after. We left at 12:05 PDT. I will collect the pond data next time. |
Field Data
No tank data
Well Depth
| Date | Location | Depth (feet) |
|---|---|---|
| 2023-07-06 | TZ_floor | 18.9 |
| 2023-07-06 | TZ_tower | 23.6 |
| 2023-07-06 | TZ_road | 28.2 |
| 2023-07-06 | VR_well | 50.4 |
No TZ Moisture Point data found
No VR Moisture Point data found
No TZ grass heigth found
No VR grass heigth found
No VR Tree DBH found
No water potential data found
No VR Grass Biomass data found
No VR OakLeaves Biomass data found
No VR PineNeedles Biomass data found
1 photos found

vaira_2023_07_06_103125.jpg ( 2023-07-06 18:31:46 ) Full size: 1296x960
Daphne on site
9 sets found
16 VR_met graphs found
2 VR_flux graphs found
No data found for VR_soilco2.
2 VR_pond graphs found
Can't check TZVR_mixed
3 VR_fd graphs found
4 VR_processed graphs found
4 VR_arable graphs found
6 VR_soilvue graphs found

