
Field Notes
<--2023-01-06 12:00:00 | 2023-02-08 12:30:00-->Other sites visited today: Vaira | Gilbert Tract
Phenocam link: Searching...
Tonzi: 2023-01-25 12:00:00 (DOY 25)
Author: Joe Verfaillie
Others:
Summary: Still wet branches and trees down, OSU SP1 having problems, replaced Tower top T/RH fan, reset Stardot clock and changed power, added diodes to Li power packs.
| Tonzi 2023-01-25 I arrived at about 12:00 noon. A tree has fallen near the gate and another pine near Tonzi’s old house. Some big branches fell near the tower site but I didn’t notice any more big trees down. There were lots of trees down in the larger Sacramento area. The ground is still saturated with puddles on the road and the pond looking a little higher. I collected the data at the Tower and the Floor. The OSU SP1 CR3000 seem to be having problems. I think it lost power due to a low battery but its memory seems to have been corrupted. Even though I could connect, it said the program wasn’t running and I couldn’t get any recent data (after the 18th). When I stopped and restarted the program it claimed it had to reset memory. Later I powered cycled it and it seem to be running, but just before I left I still didn’t see any new data. The Tower read: 444.4ppm CO2, 383.3mmol/m3 H2O, 14.93C, 100.1kPa, 101.2SS The Floor read: 447.7ppm CO2, 356.0mmol/m3 H2O, 16.27C, 100.2kPa, 100.1SS I replace the T/RH fan at the top of the Tower. The Stardot clock had reset itself twice in the last couple weeks. I reset its clock from 2000-01-10 11:16:22 to 2023-01-25 12:54:20. Then I rewired the power moving the Stardot from the SW12V on the CR1000 to the 12V power strip and moving the Ethernet hub from the 12V power strip to the SW12V on the CR1000. So now the hub and modem should get turned off overnight and the camera should have power at all times. I changed the lithium power pack charging hardware. I added two diodes so that power from the battery cannot flow back towers the DC-DC converters and solar panels. The IRT system had no data since last time and I think there might also have been a bad wire in the power connections there. The road well has also lost some power in the last few weeks – I added diodes there too. I measured most of the Moisture Point sensors – they seem to better in the wet. I think the ground swells to make better contact and they just aren’t very good at the super dry conditions. I measured the well, no escaping air like last time. I read the dendrometers and serviced the z-cams – the photos I missed last time were still on z-cam 1. As I was testing that camera it took one of its regularly scheduled photos. This led to a short period of confusion as the camera seemed to have a mind of its own. I left at about 15:40 |
Field Data
No tank data
Well Depth
| Date | Location | Depth (feet) |
|---|---|---|
| 2023-01-25 | VR_well | 52.1 |
| 2023-01-25 | TZ_floor | 24.25 |
| 2023-01-25 | TZ_road | 31.1 |
| 2023-01-25 | TZ_tower | 27.4 |
No TZ Moisture Point data found
No VR Moisture Point data found
No TZ grass heigth found
No VR grass heigth found
Tree DBH
| Date | Tag# | Reading (mm) |
|---|---|---|
| 2023-01-25 | 1 | 12.2 |
| 2023-01-25 | 102 | 6.3 |
| 2023-01-25 | 2 | 19.5 |
| 2023-01-25 | 245 | 7.1 |
| 2023-01-25 | 3 | 23.1 |
| 2023-01-25 | 4 | 21.1 |
| 2023-01-25 | 5 | 12.5 |
| 2023-01-25 | 6 | 22.7 |
| 2023-01-25 | 7 | 13.3 |
| 2023-01-25 | 72 | 17.3 |
| 2023-01-25 | 79 | 16.4 |
No water potential data found
No TZ Grass Biomass data found
No TZ OakLeaves Biomass data found
No TZ PineNeedles Biomass data found
1 photos found
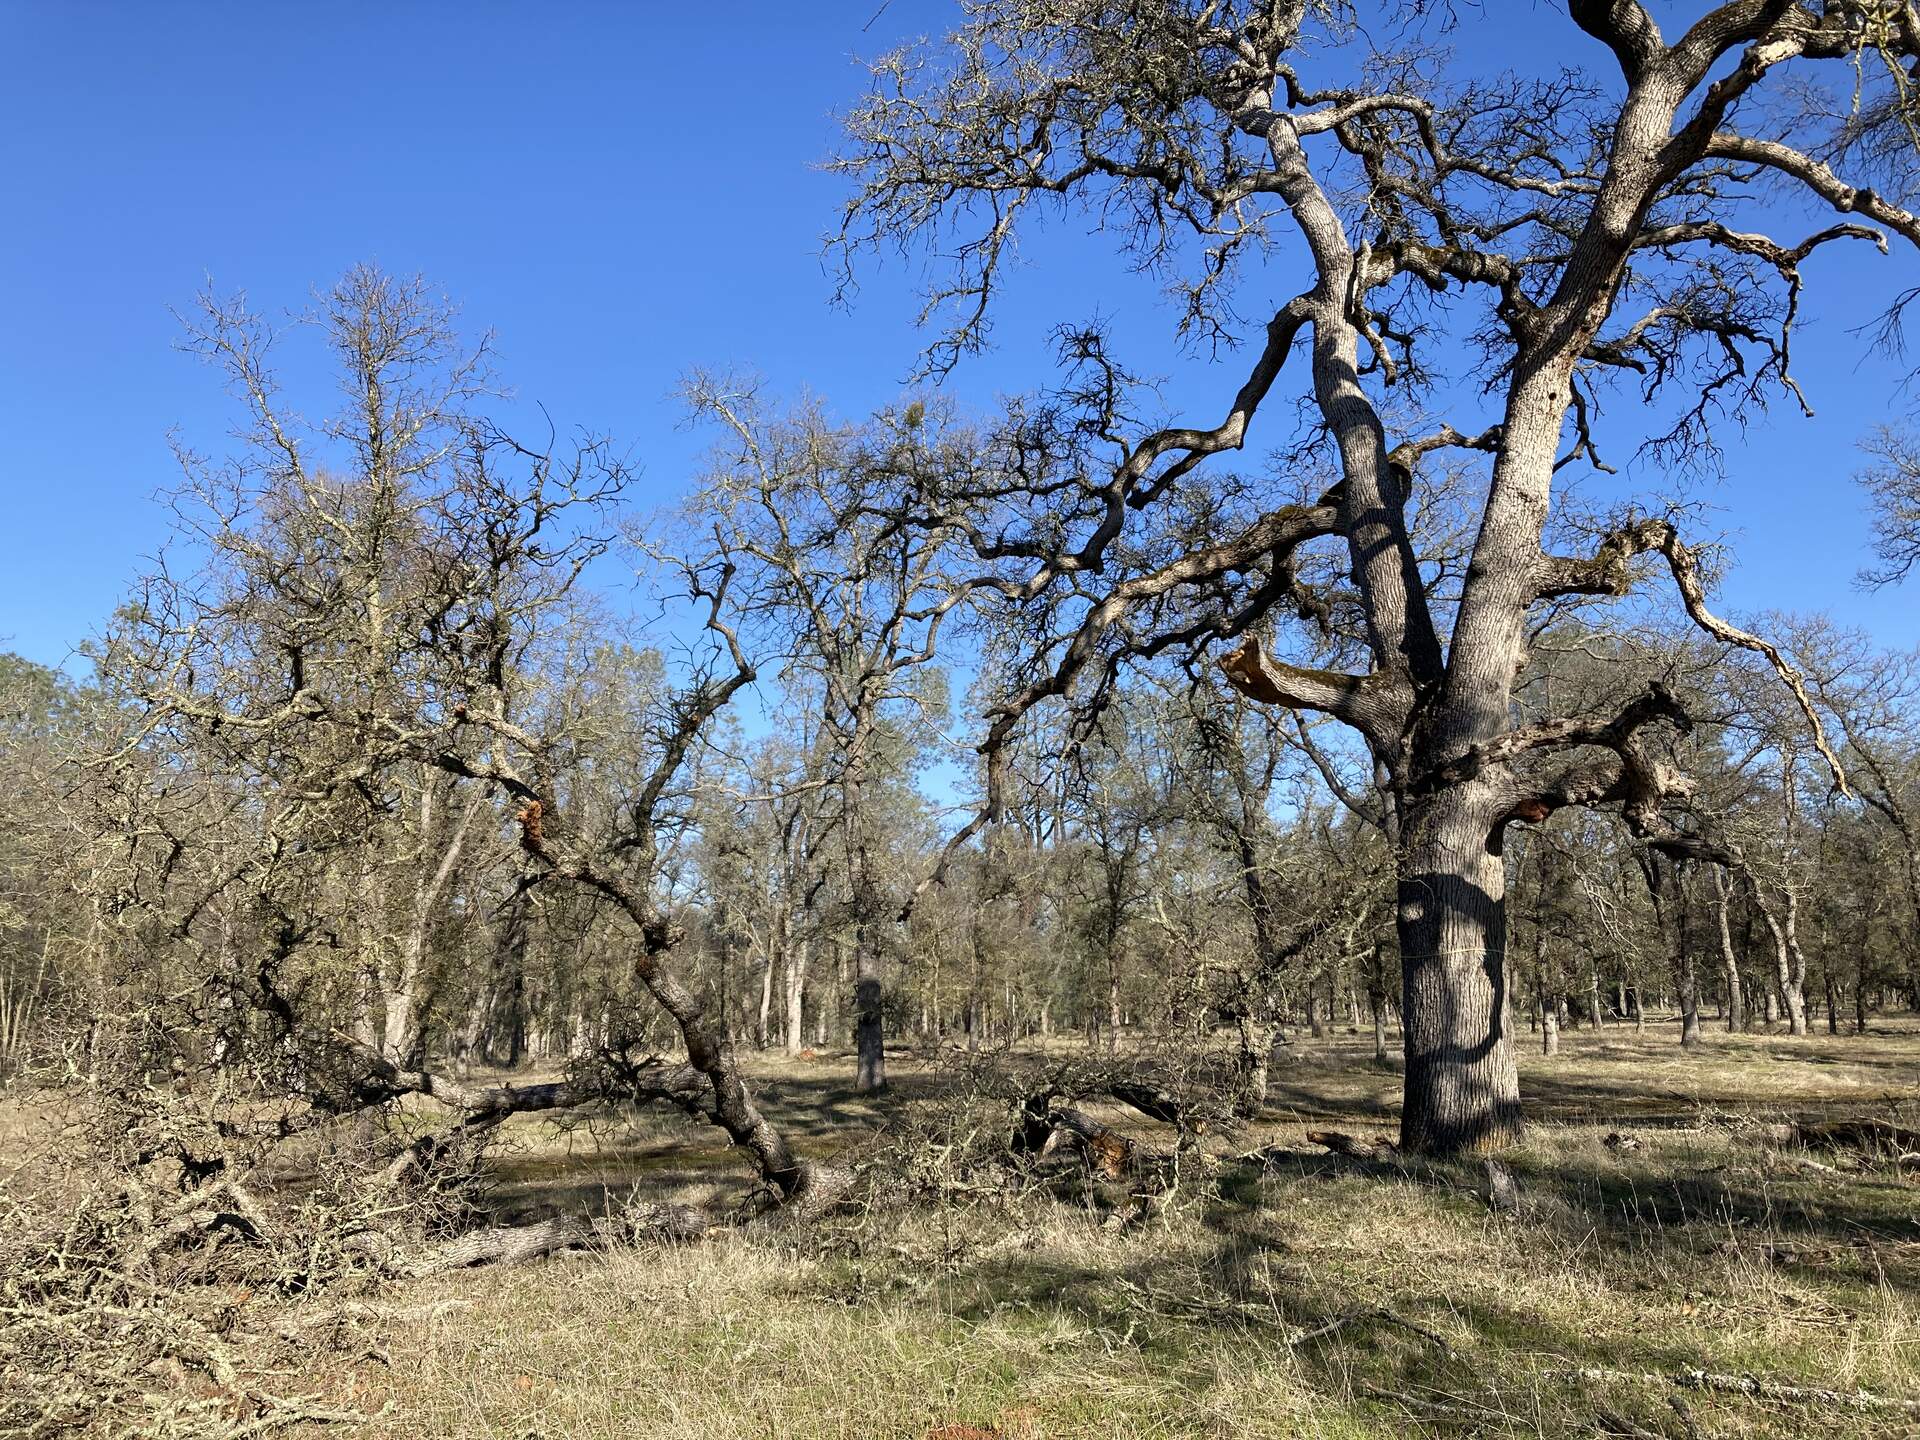
20239125TZ_BranchDown.jpg ( 2023-01-25 14:27:56 ) Full size: 1920x1440
Big branch fell off this tree more branches and trees down in larger area
16 sets found
No data found for TZ_Fenergy.
11 TZ_tmet graphs found
No data found for TZ_soilco2.
Can't check TZ_mixed
3 TZ_mixed graphs found
1 TZ_fflux graphs found
8 TZ_fmet graphs found
No data found for TZ_tram.
3 TZ_co2prof graphs found
No data found for TZ_irt.
No data found for TZ_windprof.
1 TZ_tflux graphs found
8 TZ_sm graphs found
Can't check TZ_met
1 TZ_met graphs found
Can't check TZVR_mixed
8 TZ_osu graphs found
3 TZ_fd graphs found
Tonzi Z-cam data