Field Notes
<--2023-01-25 12:00:00 | 2023-03-01 12:15:00-->Other sites visited today: Vaira
Phenocam link: Searching...
Tonzi: 2023-02-08 12:30:00 (DOY 39)
Author: Joe Verfaillie
Others:
Summary: Standard data collection, OSU SP1 seems okay, still power problems with IRT system, fixed cow fence around soil co2 area, FD chamber loosing power.
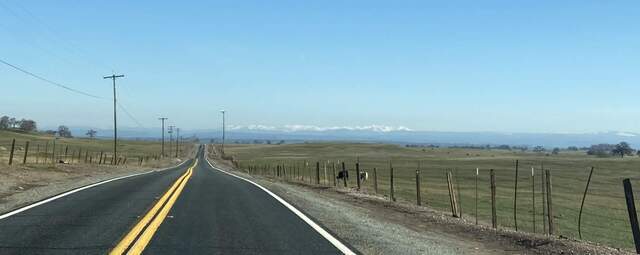
| Tonzi 2023-02-08 I arrived at about 12:30. It was clear sunny and warm with a light breeze that came and went. There is still surface water and puddles in the surrounding area. Grass has not grown very much as it is still too cold. Snow in the Sierras very visible today. I checked on the Tower – all seemed well. As I climbed to the top I pulled the cable for the upper GMP343 that was having communication problems. I didn’t see any damage to it but I will test it in the lab. The Tower read: 430.6ppm CO2, 418.9mmol/m3 H2O, 14.3C, 100.2kPa, 101.4SS The Floor read: 434.4ppm CO2, 391.4mmol/m3 H2O, 15.7C, 100.3kPa, 100.0SS I did the Moisture Point measurements, read the dendrometers, measured the wells and serviced the z-cams. I changed the desiccant in zcam-1 since its window had some condensation again. The battery for the FD chamber is losing power over night. The OSU SP1 CR3000 had a memory problem last time. Two weeks ago I reloaded its program and cycled its power but didn’t see data from it before I left. Today I didn’t see data at the Tower but I got two weeks of good looking data from it when I connected to it directly. Back at the tower I found Loggernet was sending its data to generic files in the Loggernet folders. I fixed the field paths and think it should be okay now. I was prepared to update its OS. Its running v22 and the latest is v32. This is a big change and I don’t think it needs to be done until we need some feature of the newer versions. The IRT system had not sent data either. The lithium power pack there was depleted. I think the barrel jack from the solar panels doesn’t make a good connection. I did get it to charge up to 2/4 status lights and tried to put lateral pressure on the connector to make a better connection. However, I think I’ll swap it out for a smaller pure 12V pack with proven good jacks. I fixed the cow fence around the soil co2 area. Something had destroyed it – I haven’t seen any cows recently. I pulled one post and put in another one making the area a little smaller and easier to fence. It’s a good time to pull things out of the ground. I left at about 15:20 |
Field Data
No tank data
Well Depth
| Date | Location | Depth (feet) |
|---|---|---|
| 2023-02-08 | VR_well | 51.65 |
| 2023-02-08 | VR_pond | 22.04 |
| 2023-02-08 | TZ_floor | 23.7 |
| 2023-02-08 | TZ_road | 31.25 |
| 2023-02-08 | TZ_tower | 26.65 |
No TZ Moisture Point data found
No VR Moisture Point data found
No TZ grass heigth found
No VR grass heigth found
Tree DBH
| Date | Tag# | Reading (mm) |
|---|---|---|
| 2023-02-08 | 1 | 11.7 |
| 2023-02-08 | 102 | 4.6 |
| 2023-02-08 | 2 | 19.5 |
| 2023-02-08 | 245 | 6.4 |
| 2023-02-08 | 3 | 23.0 |
| 2023-02-08 | 4 | 21.2 |
| 2023-02-08 | 5 | 12.3 |
| 2023-02-08 | 6 | 22.6 |
| 2023-02-08 | 7 | 13.3 |
| 2023-02-08 | 72 | 16.9 |
| 2023-02-08 | 79 | 16.1 |
No water potential data found
No TZ Grass Biomass data found
No TZ OakLeaves Biomass data found
No TZ PineNeedles Biomass data found
1 photos found

20230207TZ_SnowInTheSierras.jpg ( 2023-02-08 10:42:20 ) Full size: 1920x764
Snow in the Sierras on the way to Tonzi
16 sets found
No data found for TZ_Fenergy.
11 TZ_tmet graphs found
No data found for TZ_soilco2.
Can't check TZ_mixed
3 TZ_mixed graphs found
1 TZ_fflux graphs found
8 TZ_fmet graphs found
No data found for TZ_tram.
3 TZ_co2prof graphs found
1 TZ_irt graphs found
No data found for TZ_windprof.
1 TZ_tflux graphs found
8 TZ_sm graphs found
Can't check TZ_met
1 TZ_met graphs found
Can't check TZVR_mixed
8 TZ_osu graphs found
3 TZ_fd graphs found
Tonzi Z-cam data

