
Field Notes
<--2022-12-13 14:40:00 | 2023-01-06 12:10:00-->Other sites visited today: Hill Slough | West Pond | East End | Mayberry | Gilbert Tract
Phenocam link: Searching...
Bouldin Corn: 2023-01-03 14:30:00 (DOY 3)
Author: Daphne Szutu
Others: Joe
Summary: Storm prep, high water level, line power was off, FD chamber floating in water--removed, issues with GHG data files
| 2023-01-03 Bouldin Corn Joe and I arrived around 14:30 PST. It was cold and overcast and relatively still. We’ve had two big storms in the last week (Dec 26-27 and Dec 31), and another big one coming tomorrow. More storms forecast for this weekend and next week, too. One main reason to come out today was to batten down the hatches before tomorrow’s “atmospheric river bomb cyclone storm.” Many birds on our field and on neighboring fields: tundra swans, snow geese, greater white-fronted geese, and ducks. The wheat field to our SE looked dry but the wheat field to our S was flooded and most of the wheat plants were submerged. The water level is shin deep at the tower and there were various objects floating in the water: pieces of lumber, red plastic cases the Silver Lab uses to prop up their chambers, a deflated mylar ballon in the shape of a giant ‘3’, and our FD chamber. The FD chamber was bobbing on its side, unfortunately with the cable connection under water. I brought the chamber sn FD20180067 and cable back to the lab for testing. We removed the balloon to throw away. Line power was out when we arrived. Tyler and Charlotte reported that line power had been down since 2022-12-31 and was expected to be restored tonight, 2023-01-03. I could download almost all the data I could without tower power: USB GHG, camera, PA, and IRT. The USB had about 9000 files on it when it should have around 1000. Lots of small files and lots of files labeled June 2023. We’ll have to see how complete this data is. Joe tightened down all 4 guywires by about 1 chainlink. At the last site visit three weeks ago, he had also tightened everything down, so the tower has sunk since then. He removed both boardwalks from the tower and stashed them by the side of the road. One of the Silver lab blue boxes (the one closer to the road) was partly submerged and the bottom few inches of the AC unit were under water. We lifted the box up and propped it up on the taller PVC collars so that the AC unit was out of the water. We left around 15:40 PST. We’ll be back on Friday to check on the tower after this storm. Hopefully we’ll have power by then and I can download data. Maybe I’ll bring a power pack so I can get the CR1000 data. |
1 photos found
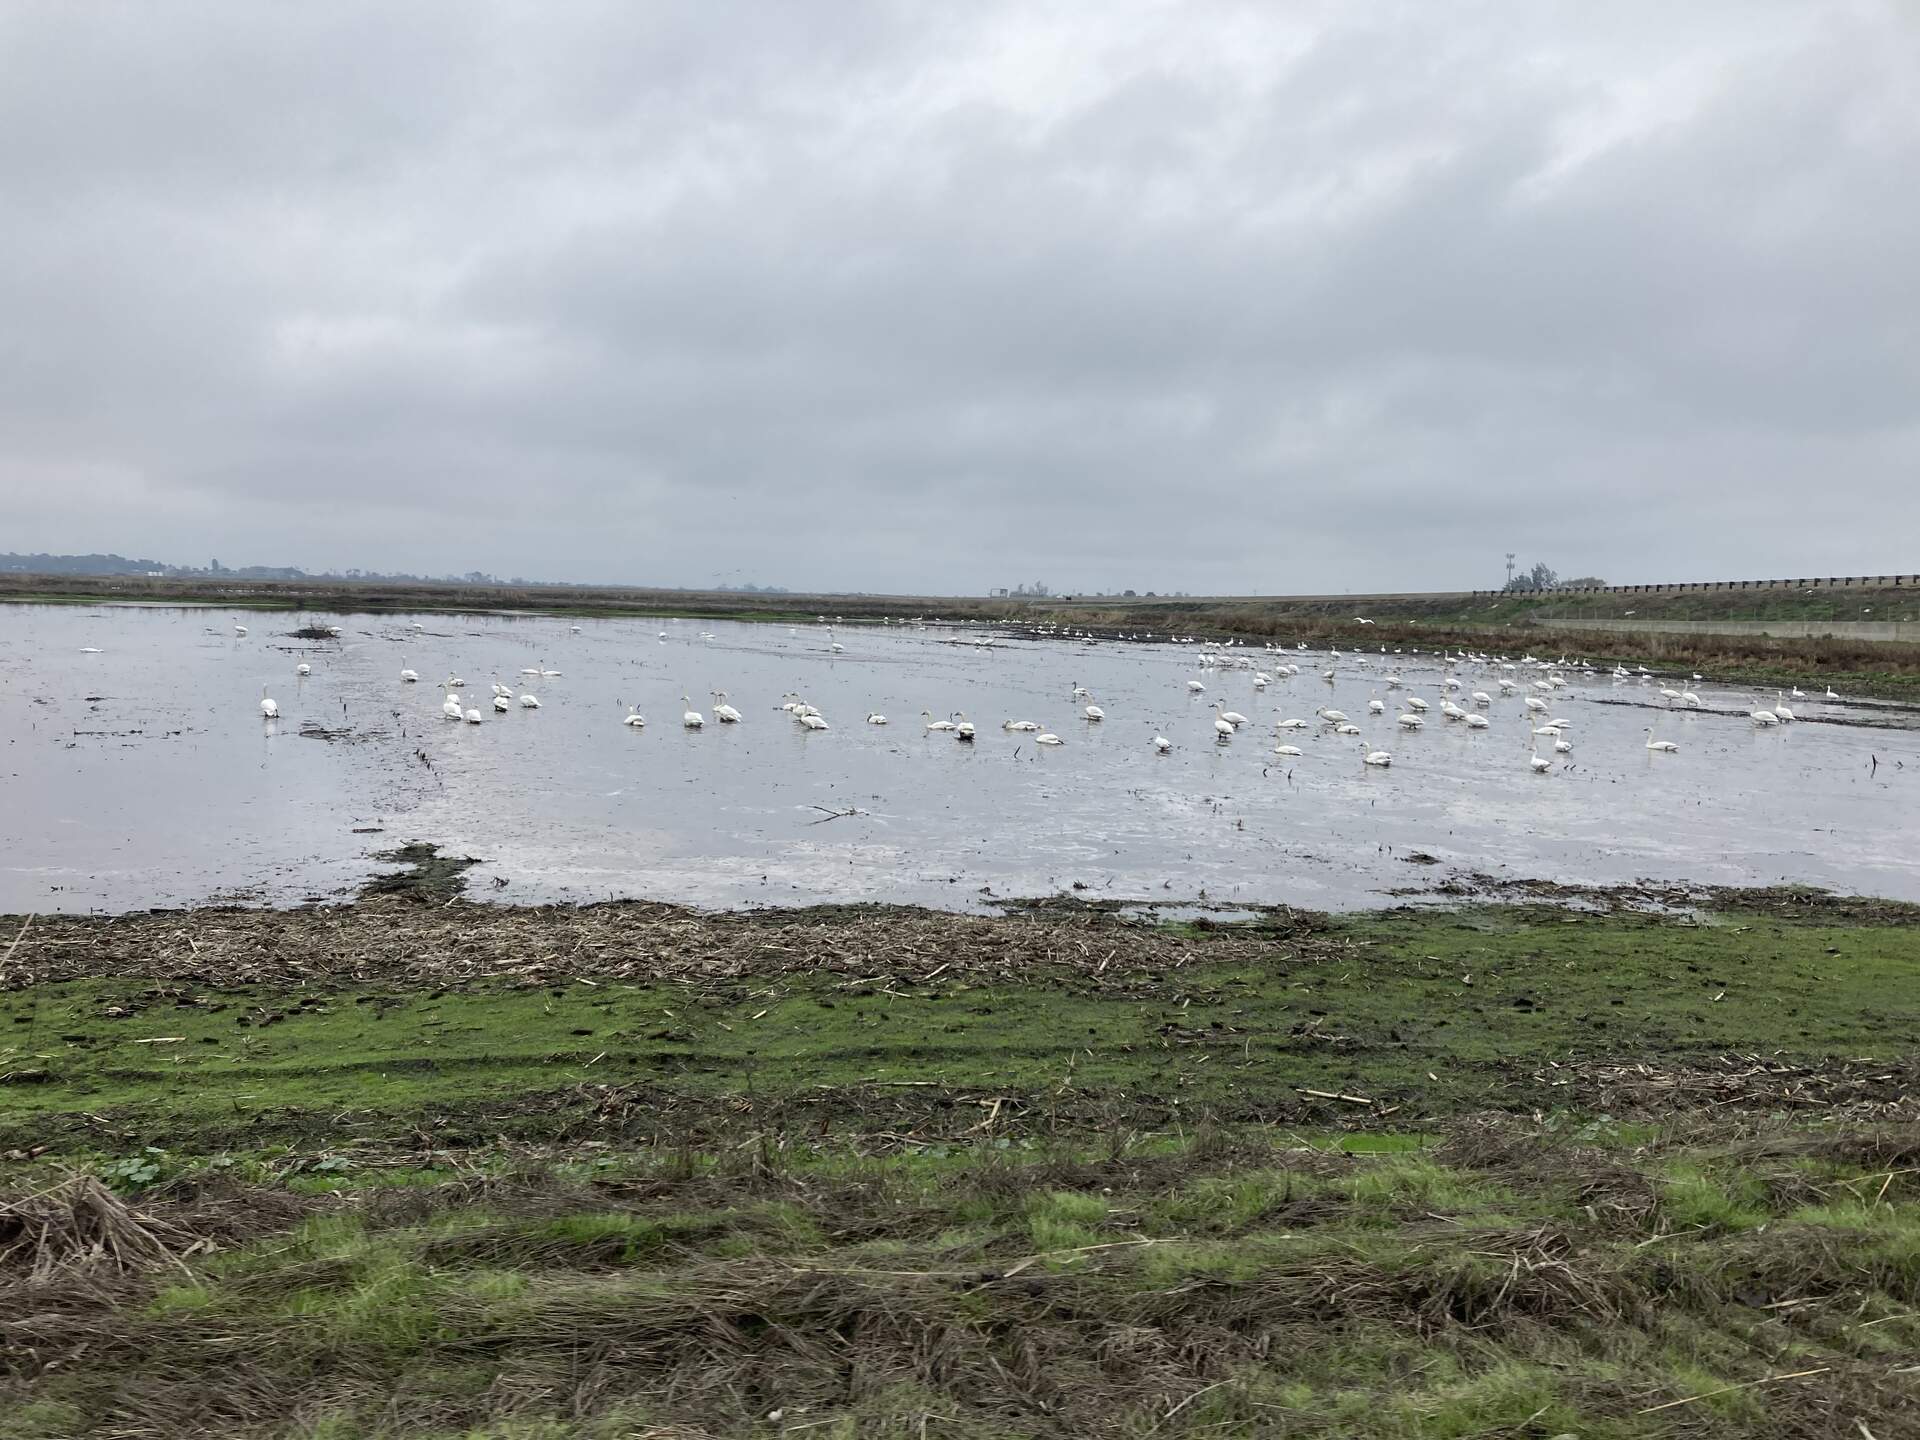
20230103BC_WinterBirds.jpg ( 2023-01-03 15:42:24 ) Full size: 1920x1440
Tundra swans and snow geese here for the winter
6 sets found
17 BC_met graphs found
5 BC_flux graphs found
Can't check TATWBABCSB_cam
Can't check MBSWEEWPBCBA
2 BC_pa graphs found
1 BC_arable graphs found