
Field Notes
<--2022-11-30 12:45:00 | 2023-01-03 14:30:00-->Other sites visited today: Gilbert Tract | Mayberry | West Pond | East End | Bouldin Alfalfa
Phenocam link: Searching...
Bouldin Corn: 2022-12-13 14:40:00 (DOY 347)
Author: Joe Verfaillie
Others:
Summary: Field is flooded. Leveled scaffolding and tightened guys, replaced shadow band that had fallen off, moved soil sensors into the field.
| Bouldin Corn 2022-12-13 I arrived at 14:40. It was clear, sunny and mild with no wind. Some of the fields to the west are flooded. Our field is flooded but the other three fields in our group (W, NW, N) I don’t think had water. Fields to the east, southeast and south all have wheat sprouting in them. A farmer came and shot a screamer at some geese in one of the wheat fields. I collected USB, camera, met, IRT, Purple Air, and FD data. I did not clear the FD chamber’s memory. The 7500 read: 429.8ppm CO2, 289.9mmol/m3 H2O, 13.3C, 101.9kPa, 102.2SS – 102.5 after cleaning The 7700 read: 2.02ppm CH4, 52.2RSSI – 1.98ppm CH4, 81.6RSSI after cleaning I refilled the wash reservoir by half. From the top of the scaffolding I could feel that it was leaning a little towards the field. The flooding has made the soil very soft in spots. I leveled the scaffolding mostly by raising the feet of the scaffolding along the field edge. Then I made sure that all the guy wires were tight. The shadow band had fallen off – I found it on the ground. I reattached it and tighten all the screws. I moved the three batches of ground sensors into the field. Under the tower, all the Campbell soil moistures were in vertically with the tops of the probes about 15cm below the surface. In the field the sensors went in under about 15-20cm of water. The soil heat flux plates at about -2cm. The soil moisture are in vertically with their tops about 5cm below the surface. There wasn’t any electrical tape in the field supplies so I used some copper tape to reattach two of the bottom TCs. The sensor set with soil moisture sn 17129 went to the northwest, sn 17133 to the west and sn 17128 to the southwest. I didn’t move the theta soil moisture probe. The stakes holding the FD chamber have rotted to almost nothing and it doesn’t have a collar. I washed the mud off it and out of it with the spray bottle then placed it in a little higher spot under the scaffolding frame and tied the cable to the frame to help hold it in place. I left at 16:20 |
11 photos found
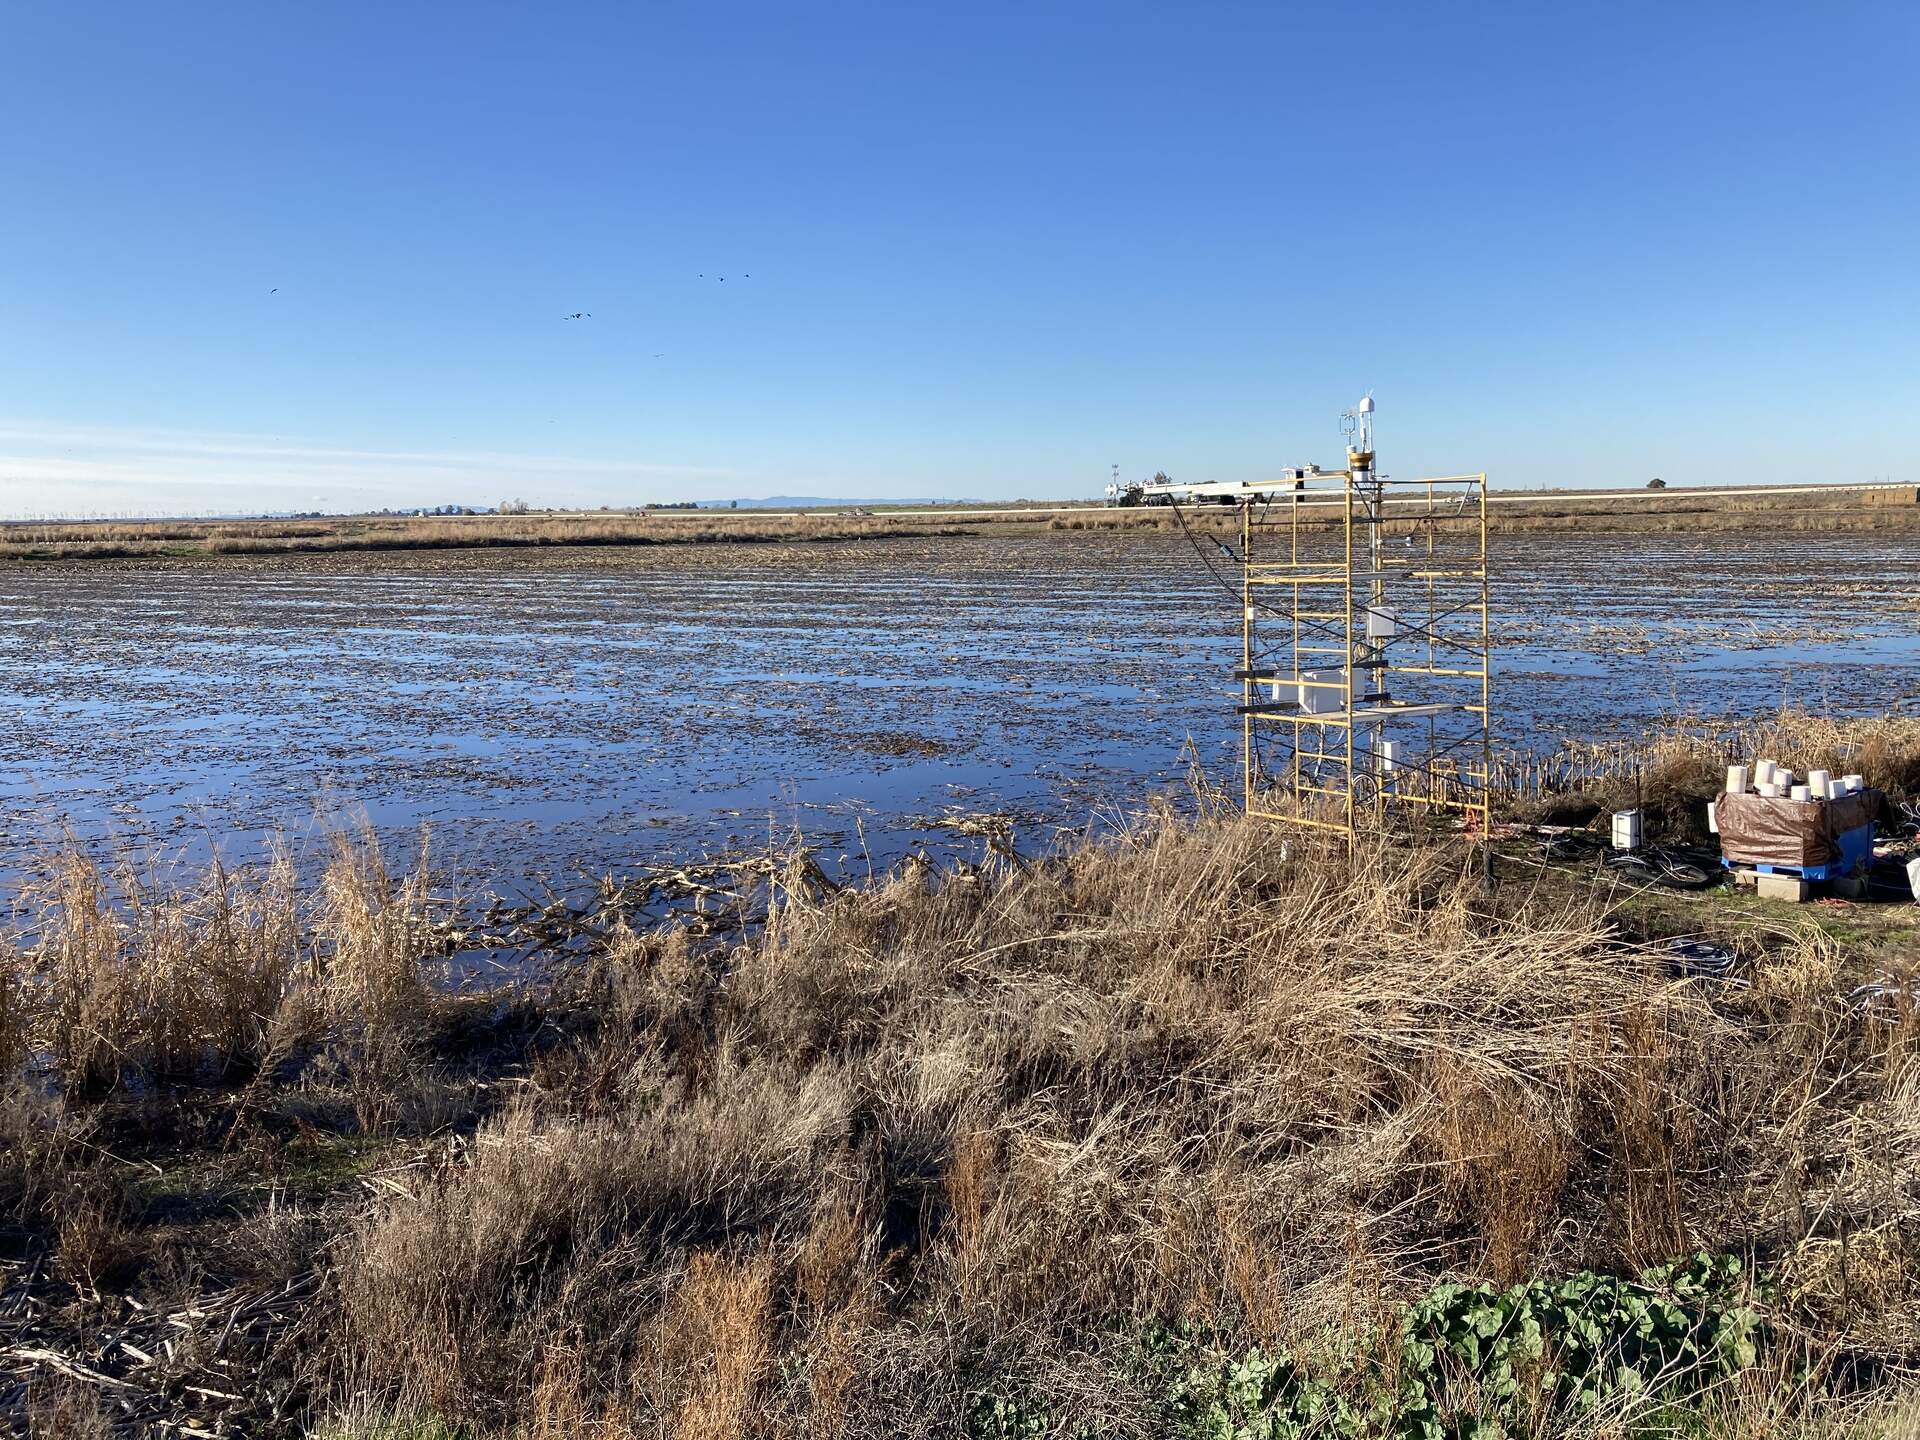
20221213BC_FieldFlooded.jpg ( 2022-12-13 14:36:10 ) Full size: 1920x1440
The field has been flooded

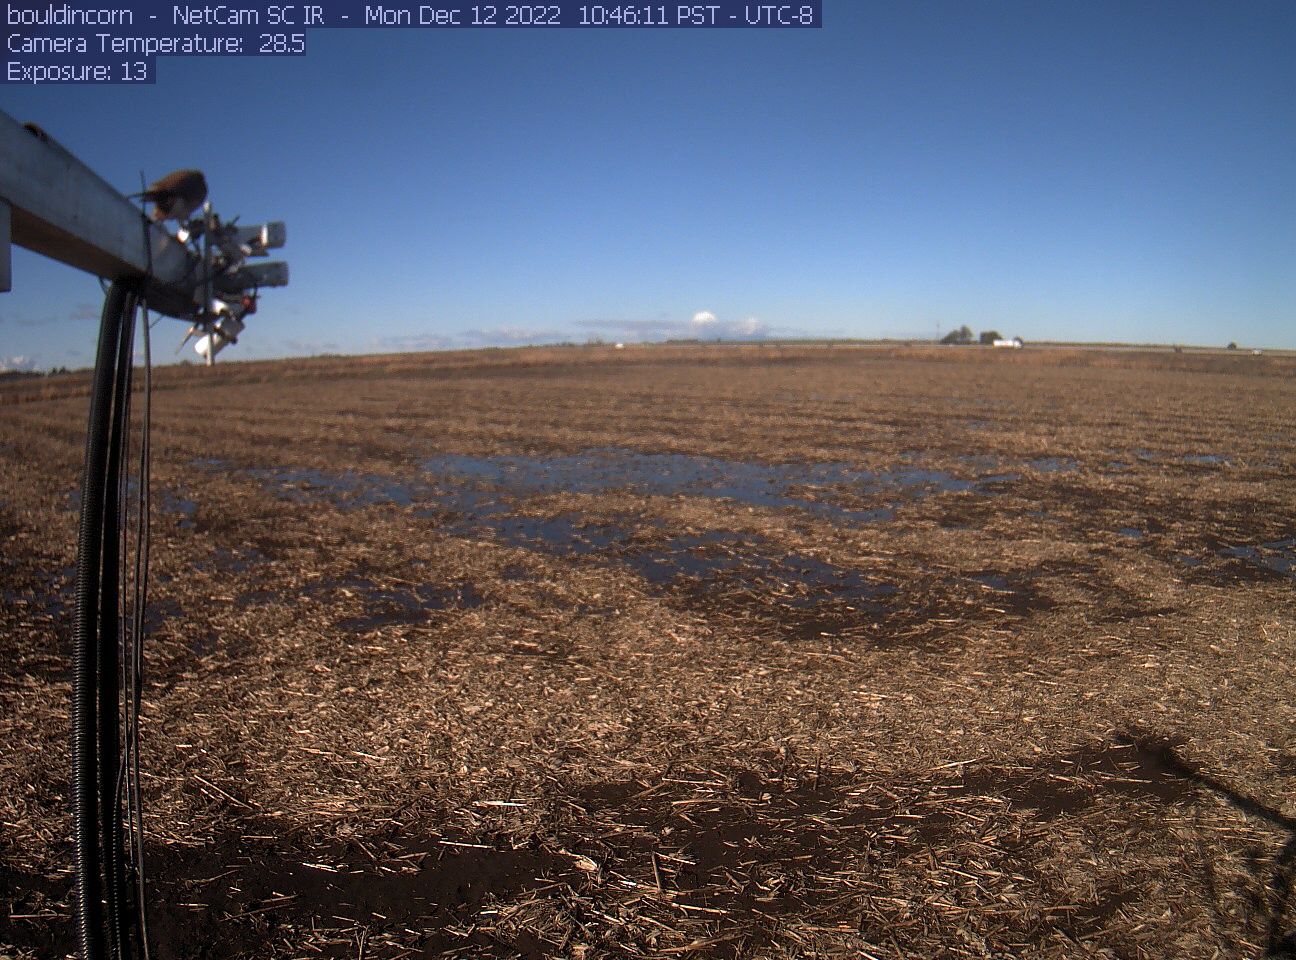
bouldincorn_2022_12_12_074506.jpg ( 2022-12-12 15:46:52 ) Full size: 1296x960
Puddles on the field, beginning of flooding?
bouldincorn_2022_12_12_104505.jpg ( 2022-12-12 18:46:54 ) Full size: 1296x960
Field being flooded

bouldincorn_2022_12_12_121505.jpg ( 2022-12-12 20:16:52 ) Full size: 1296x960
Kestral on radiometers as field is flooded

bouldincorn_2022_12_12_154505.jpg ( 2022-12-12 23:46:54 ) Full size: 1296x960
Field is flooding

bouldincorn_2022_12_12_164505.jpg ( 2022-12-13 00:46:50 ) Full size: 1296x960
Snow geese on flooded field
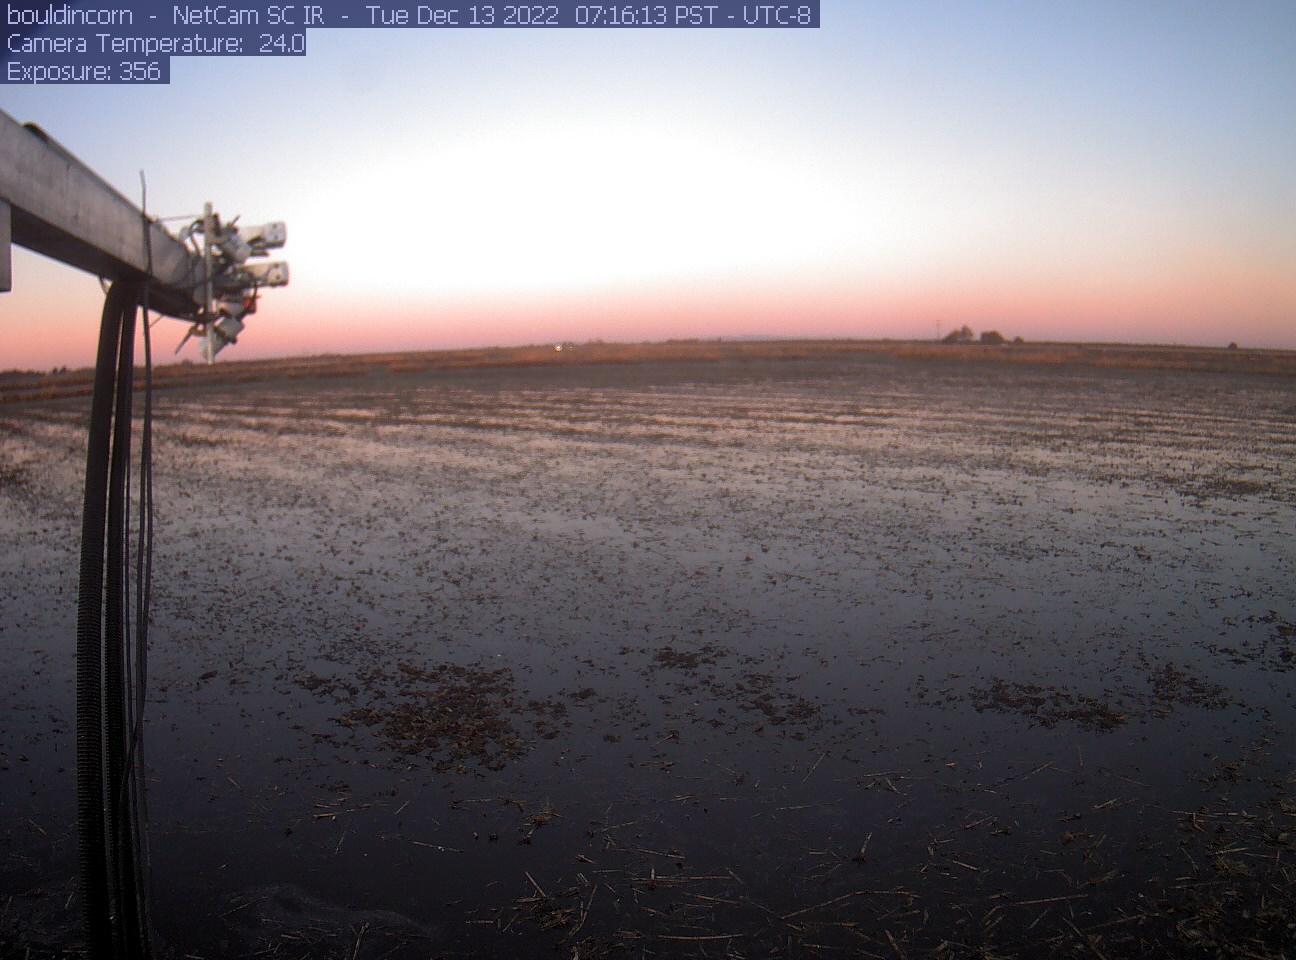
bouldincorn_2022_12_13_071506.jpg ( 2022-12-13 15:16:54 ) Full size: 1296x960
Dawn on fully flooded field

bouldincorn_2022_12_13_074505.jpg ( 2022-12-13 15:46:52 ) Full size: 1296x960
Geese on flooded field

bouldincorn_2022_12_13_081506.jpg ( 2022-12-13 16:16:54 ) Full size: 1296x960
Snow geese on flooded field

bouldincorn_2022_12_13_084505.jpg ( 2022-12-13 16:46:54 ) Full size: 1296x960
Snow geese on flooded field
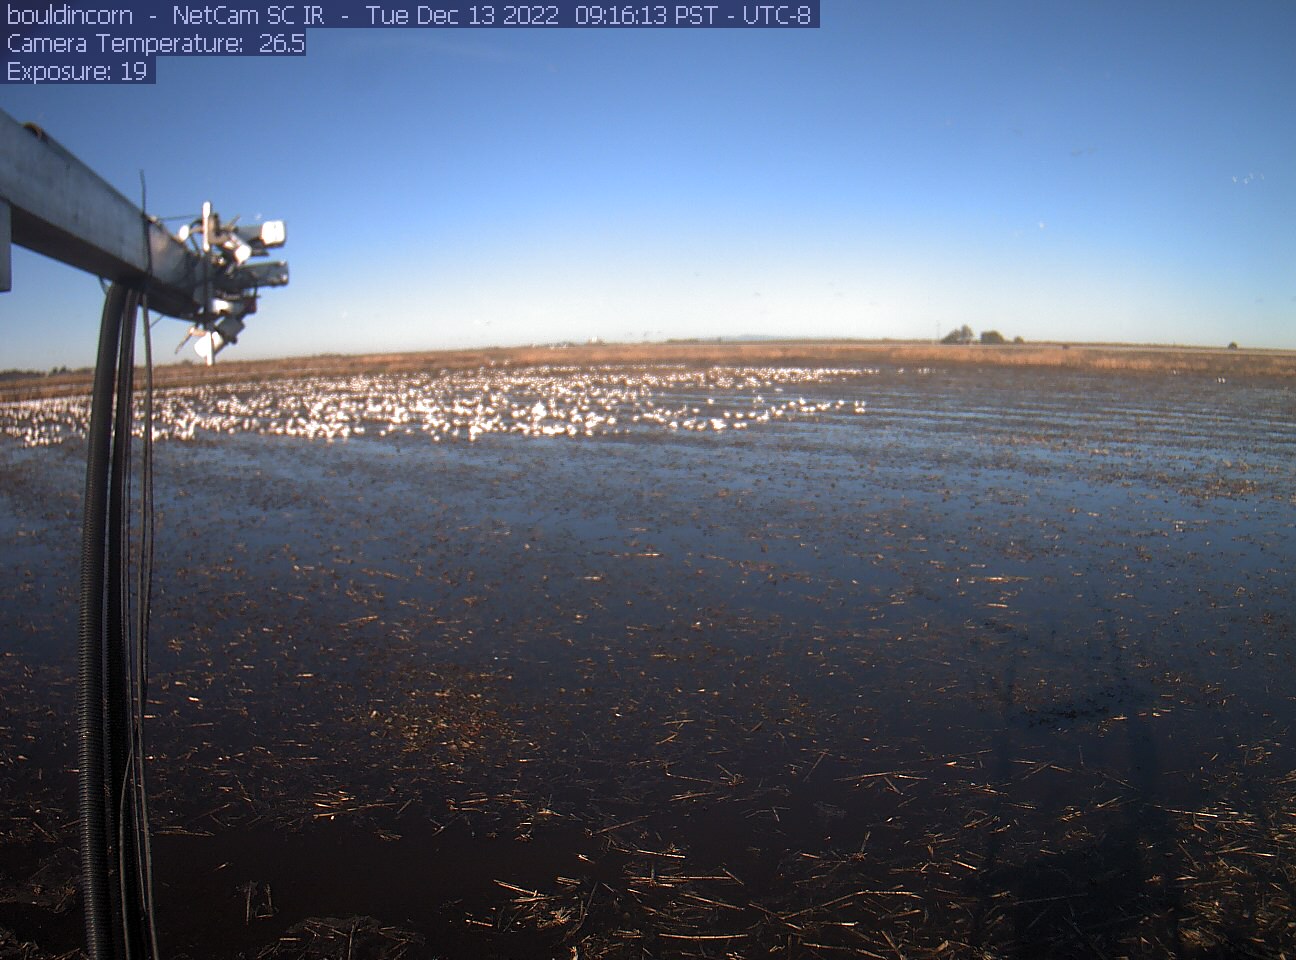
bouldincorn_2022_12_13_091506.jpg ( 2022-12-13 17:16:54 ) Full size: 1296x960
Snow geese on flooded field
6 sets found
17 BC_met graphs found
5 BC_flux graphs found
Can't check TATWBABCSB_cam
Can't check MBSWEEWPBCBA
2 BC_pa graphs found
1 BC_arable graphs found