
Field Notes
<--2022-04-12 11:00:00 | 2022-05-10 13:10:00-->Other sites visited today: Vaira | Bouldin Alfalfa
Phenocam link: Searching...
Tonzi: 2022-04-27 11:00:00 (DOY 117)
Author: Joe Verfaillie
Others: Beckman crew
Summary: Beckman inspected the tower - sounds like it is in good shape, Added two soil matrix potential sensors, reinstalled Tree1 FD chamber, Moved IRTs for cal, midday water potential
| Tonzi 2022-04-27 I arrived at about 11:00am PDT. It was clear and sunny with a light cool breeze. Many more flowers here than last time. Some puddles on the road, but I don’t think it rain since about two weeks ago. The grasses and trees look good. A crew from Beckman Tower (Carl Jr., Matt, Lauren?) arrived at about noon in two trucks. I had quickly grabbed the data from the tower before they arrived so I could stay out of their way while they inspected the tower. They cleaned off the guy wire anchors, adjusted all the guy wires to about 700lbs, cleaned, inspected and sealed all the fittings. They used two survey instruments to inspect the tower plumb – it was nearly perfect with only one corner being half the width of the post out of line. They climbed the tower and inspected all the structure. In general they were impressed with how good of condition it was in for standing 22 years. I’ll get a report from them later. I added two TEROS21 soil matrix potential probes to the Floor Met 23x. Both probes were installed near the Tower Moisture Point probe. Probe sn G20007112 went near the drip line on the trees 3.84m WSW (260deg) from the Moisture Point probe. Probe sn G20010035 went near the trees (roots in the hole) 0.7m W (90deg) from the Moisture Point probe. Both were installed at -10cm by digging a small hole, cutting a groove in the side, packing some wetted soil around the probe and inserting it in the groove per instructions. On the data logger they have good temps (18.4, 16.8) and matrix potential readings of -54.8kPa and -218.1kPa (-5kPa wet soil, -100,000kPa dry air). The installation video shows them inserted in a vertical plane but I inserted then in the horizontal plane – written instructions don’t specify orientation so maybe okay. In the Data logger table MP_A is sn G20007112 (drip line) and MP_B is sn G20010035 (under tree). The soil under the tree seemed a bit dryer to me. The ground IRT by the small tree was out of its mount. I fixed it then some cows came to inspect it. I yell at them and clapped my hands and told they can't touch it. I collected the met, flux, cameras, well and FD data. I read the dendrometers, did the manual well and soil moisture measurements. I did midday tree water potential – kind of a mix of numbers from -10 to -25Bar. Tower 7500 read: 414.6ppm CO2, 453.0mmol/m3 H2O, 99.0kPa, 16.1C, 103.7SS Floor 7500 read: 417.5ppm CO2, 464.2mmol/m3 H2O, 99.0kPa, 22.0C, 100.1SS I reinstalled the Tree1 FD chamber sn FD20180048. I had removed it because I thought it was broken but it might have been reading funny because it was lying on its side. It seemed okay in the lab. I installed it in a slightly different location with more litter on the soil surface. I did a rough job of rearranging the IRTs near the Floor solar panels to all point at the cal panel. One of the cables of an IRT point at the tree had been chewed by the cows. I cut its end off, stripped it and rewired it to the CR10X. I dragged the CR10X box over the to the cal panel and mounted the two tree IRTs and the one grass IRT on stakes in front of the cal panel. I didn’t have time to check their readings with the laptop. I left for Vaira at about 16:10 PDT |
Field Data
No tank data
Well Depth
| Date | Location | Depth (feet) |
|---|---|---|
| 2022-04-27 | TZ_floor | 24.95 |
| 2022-04-27 | TZ_road | 33.5 |
| 2022-04-27 | TZ_tower | 28.6 |
| 2022-04-27 | VR_well | 54.25 |
| 2022-04-27 | VR_pond | 17.75 |
mode = both
Moisture Point Probes TZ
Array
(
[0] => Tower_1
[1] => Floor_South_1
[2] => Soil_Transect_3_1
[3] => Soil_Transect_2_1
[4] => Soil_Transect_1_1
[5] => SoilCO2_West_A_1
[6] => SoilCO2_West_B_1
[7] => SoilCO2_West_C_1
[8] => Tower_2
[9] => Soil_Transect_3_2
[10] => Soil_Transect_2_2
[11] => Soil_Transect_1_2
[12] => SoilCO2_West_A_2
[13] => SoilCO2_West_B_2
[14] => SoilCO2_West_C_2
[15] => Tower_3
[16] => Floor_South_3
[17] => Soil_Transect_4_3
[18] => Soil_Transect_3_3
[19] => Soil_Transect_2_3
[20] => Soil_Transect_1_3
[21] => SoilCO2_West_A_3
[22] => SoilCO2_West_B_3
[23] => SoilCO2_West_C_3
[24] => Tower_4
[25] => Floor_South_4
[26] => Soil_Transect_4_4
[27] => Soil_Transect_3_4
[28] => Soil_Transect_2_4
[29] => Soil_Transect_1_4
[30] => SoilCO2_West_A_4
[31] => SoilCO2_West_B_4
[32] => SoilCO2_West_C_4
[33] => Soil_Transect_4_1
[34] => Floor_South_2
[35] => Soil_Transect_4_2
)
| Date | DOY | Rep | Depth | Tower_1 |
Floor_South_1 |
Soil_Transect_3_1 |
Soil_Transect_2_1 |
Soil_Transect_1_1 |
SoilCO2_West_A_1 |
SoilCO2_West_B_1 |
SoilCO2_West_C_1 |
Tower_2 |
Soil_Transect_3_2 |
Soil_Transect_2_2 |
Soil_Transect_1_2 |
SoilCO2_West_A_2 |
SoilCO2_West_B_2 |
SoilCO2_West_C_2 |
Tower_3 |
Floor_South_3 |
Soil_Transect_4_3 |
Soil_Transect_3_3 |
Soil_Transect_2_3 |
Soil_Transect_1_3 |
SoilCO2_West_A_3 |
SoilCO2_West_B_3 |
SoilCO2_West_C_3 |
Tower_4 |
Floor_South_4 |
Soil_Transect_4_4 |
Soil_Transect_3_4 |
Soil_Transect_2_4 |
Soil_Transect_1_4 |
SoilCO2_West_A_4 |
SoilCO2_West_B_4 |
SoilCO2_West_C_4 |
Soil_Transect_4_1 |
Floor_South_2 |
Soil_Transect_4_2 |
Avg | Spacial Count |
Measurement Count |
|---|---|---|---|---|---|---|---|---|---|---|---|---|---|---|---|---|---|---|---|---|---|---|---|---|---|---|---|---|---|---|---|---|---|---|---|---|---|---|---|---|---|---|
| 2022-04-27 | 117 | 0 | nan | 15.3 | 8.6 | 12.4 | 14.1 | 6.5 | 23.2 | 15.6 | 7.8 | 18.2 | 25.2 | 24.9 | 7.2 | 18.8 | 9 | 22.8 | 19 | 21.5 | 17 | 17.9 | 25.4 | 18.7 | 20.1 | 23.2 | 15.4 | 27.4 | 20.2 | 16.8 | 20.5 | 41.7 | 17.9 | 25.4 | 16.2 | 19.3 | ||||||
| 2022-04-27 | 117 | 1 | nan | 15.6 | 13 | 13.5 | 12.7 | 6.8 | 22.6 | 15.3 | 8.3 | 17.6 | 24.9 | 24.3 | 7.2 | 18.2 | 9.3 | 23.4 | 19.3 | 21.5 | 17.3 | 17.9 | 25.1 | 19 | 20.9 | 22.9 | 15.6 | 25.9 | 19.9 | 17 | 20.2 | 36 | 18.2 | 25.6 | 17 | 18.8 | 13 | 7.7 | 10.3 | |||
| 2022-04-27 | 117 | 2 | nan | 16.2 | 12.7 | 16.8 | ||||||||||||||||||||||||||||||||||||
| 2022-04-27 | 117 | Avg | 0-15cm | 0 | 0 | |||||||||||||||||||||||||||||||||||||
| 2022-04-27 | 117 | Avg | 15-30cm | 0 | 0 | |||||||||||||||||||||||||||||||||||||
| 2022-04-27 | 117 | Avg | 30-45cm | 0 | 0 | |||||||||||||||||||||||||||||||||||||
| 2022-04-27 | 117 | Avg | 45-60cm | 0 | 0 |
No VR Moisture Point data found
No TZ grass heigth found
Grass Height VR 13
| Date | Height reps (cm) | Location | Average | Samp | STDEV | ||||||||||||
|---|---|---|---|---|---|---|---|---|---|---|---|---|---|---|---|---|---|
| 2022-04-27 | 40 | 23 | 42 | 13 | 50 | 30 | 15 | 20 | 35 | 22 | 50 | 26 | 20 | GH_ALL | 29.69 | 13 | 12.12 |
Tree DBH
| Date | Tag# | Reading (mm) |
|---|---|---|
| 2022-04-27 | 1 | 21.3 |
| 2022-04-27 | 102 | 18.9 |
| 2022-04-27 | 2 | 18.1 |
| 2022-04-27 | 245 | 5.4 |
| 2022-04-27 | 3 | 21.1 |
| 2022-04-27 | 4 | 18.2 |
| 2022-04-27 | 5 | 10.2 |
| 2022-04-27 | 6 | 20.9 |
| 2022-04-27 | 7 | 12.0 |
| 2022-04-27 | 72 | 15.4 |
| 2022-04-27 | 79 | 13.8 |
Water Potential - mode: raw
| Time | Species | Tree | readings (bar) | ||
|---|---|---|---|---|---|
| 2022-04-27 13:22:00 | OAK | 102 | -7 | -22 | -10 |
| 2022-04-27 13:22:00 | OAK | 92 | -26 | -26 | -30 |
No TZ Grass Biomass data found
No TZ OakLeaves Biomass data found
No TZ PineNeedles Biomass data found
3 photos found
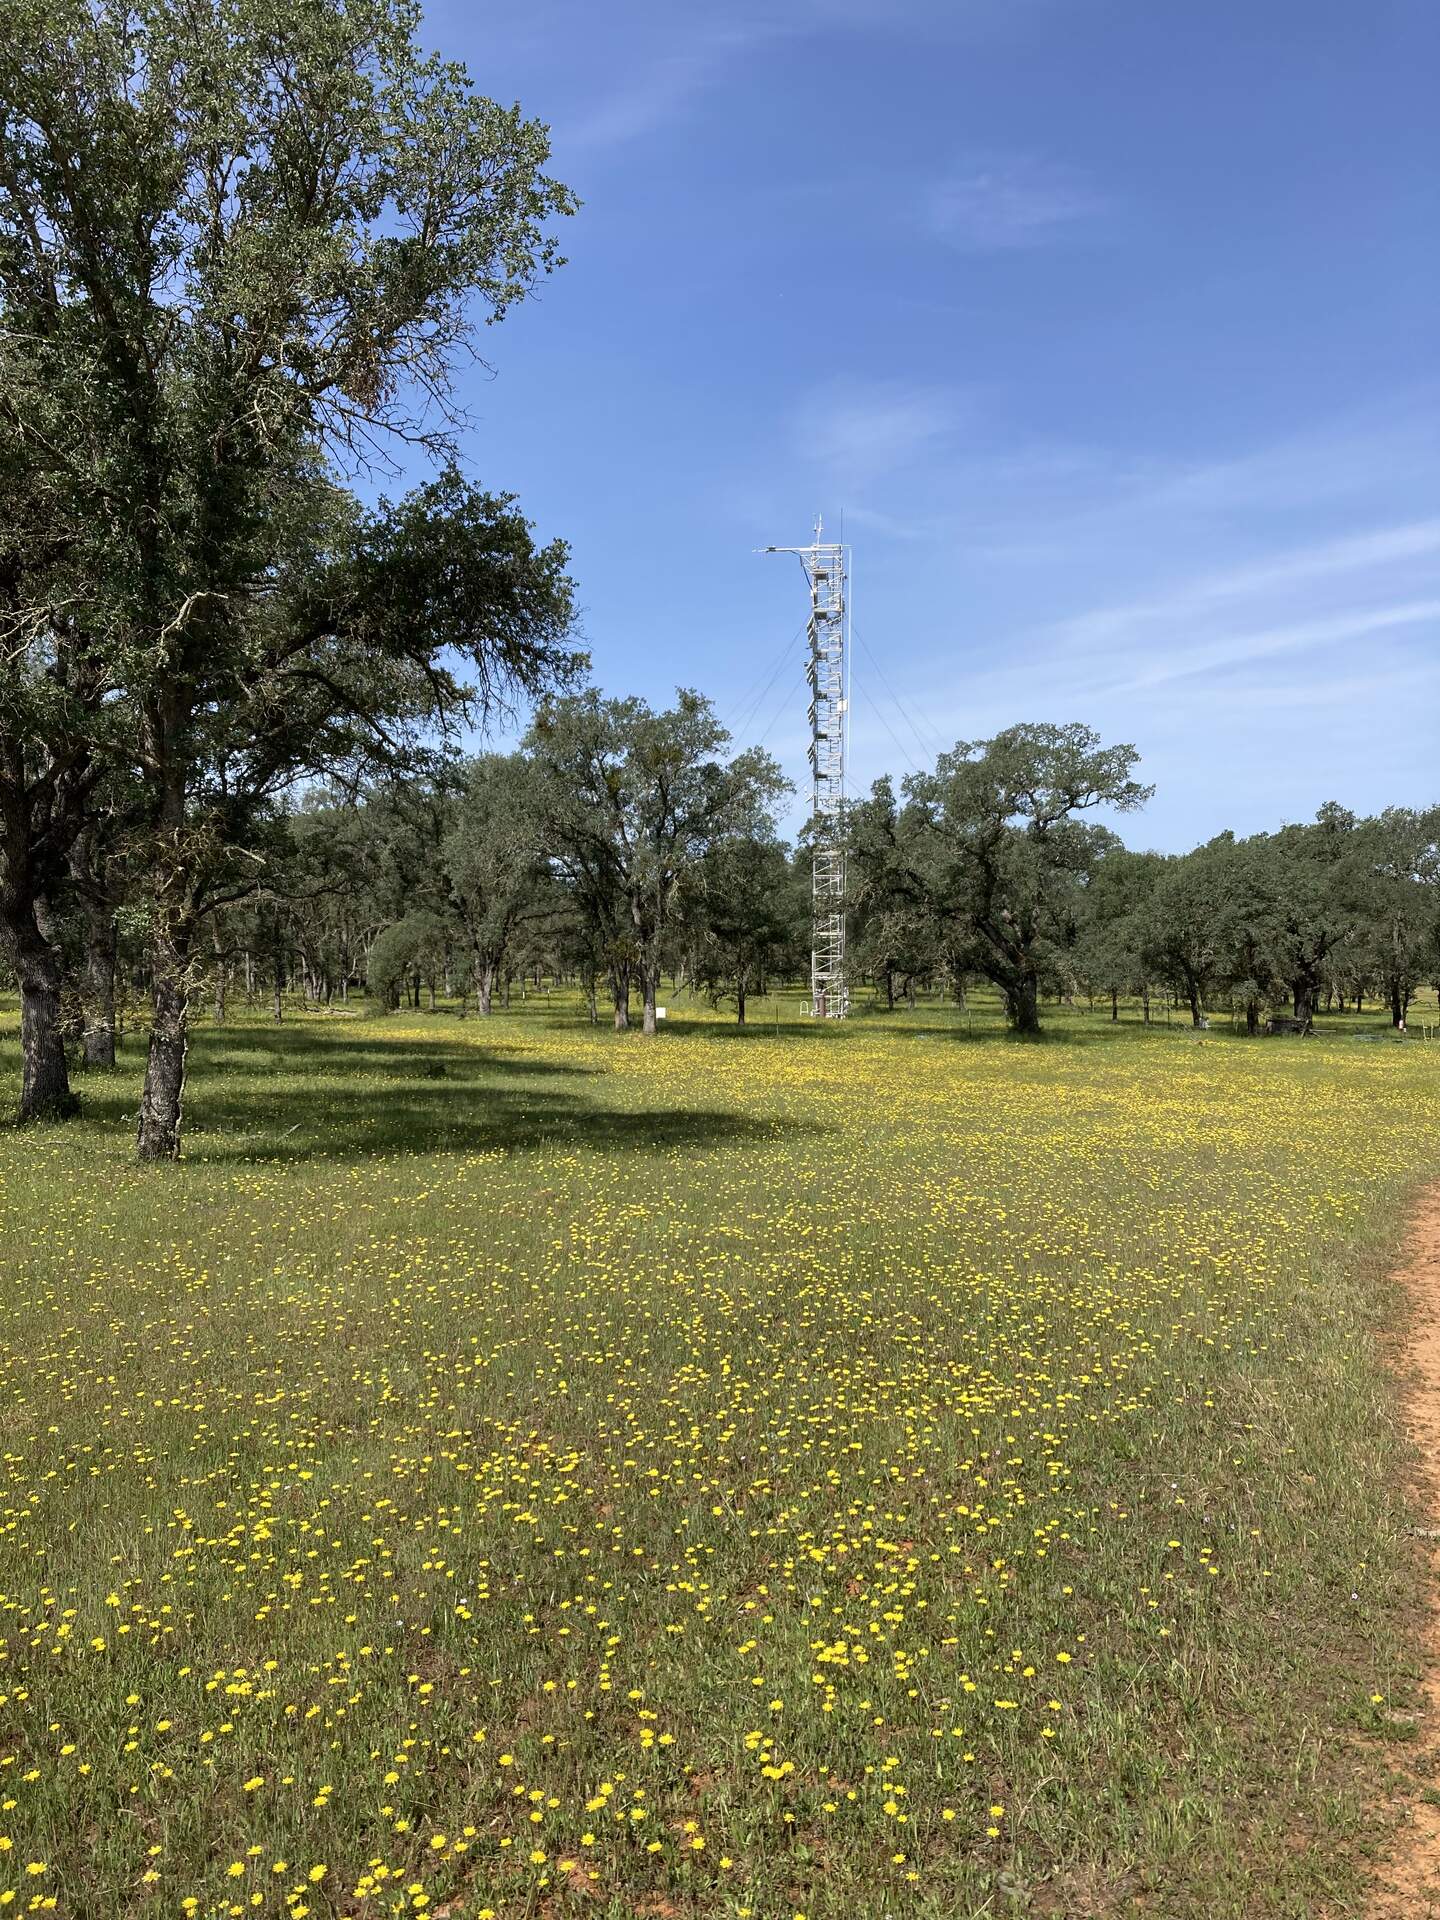
20220427TZ_TowerFlowers.jpg ( 2022-04-27 10:56:30 ) Full size: 1440x1920
Peak flower season at Tonzi

20220427TZ_MoreFlowers.jpg ( 2022-04-27 11:05:35 ) Full size: 1611x1920
Good variety of flowers: larkspur, dandelion, more

20220427TZ_BeckmanTower.jpg ( 2022-04-27 15:44:42 ) Full size: 1440x1920
The crew from Beckman checking the tower
16 sets found
No data found for TZ_Fenergy.
11 TZ_tmet graphs found
11 TZ_soilco2 graphs found
Can't check TZ_mixed
3 TZ_mixed graphs found
1 TZ_fflux graphs found
8 TZ_fmet graphs found
No data found for TZ_tram.
3 TZ_co2prof graphs found
1 TZ_irt graphs found
No data found for TZ_windprof.
1 TZ_tflux graphs found
2 TZ_sm graphs found
Can't check TZ_met
1 TZ_met graphs found
Can't check TZVR_mixed
8 TZ_osu graphs found
3 TZ_fd graphs found
Tonzi Z-cam data