
Field Notes
<--2022-04-27 11:00:00 | 2022-05-26 13:30:00-->Other sites visited today: Vaira
Phenocam link: Searching...
Tonzi: 2022-05-10 13:10:00 (DOY 130)
Author: Joe Verfaillie
Others:
Summary: Midday water potential, a little sprinkle of rain, Left IRTs running on cal panel, planning for OSU SP1 update, checked tensiometers and added clamps
| Tonzi 2022-05-10 I arrived at about 13:10 PDT. It was cool and breezy with clumps of cloud moving in from the west. One clump of cloud brought just a sprinkle of rain. I could see other scattered showers from the tower. There are more flowers here than two weeks ago. Some of our usual paths have disappeared under fresh growth. Cows are around but don’t seem to have disturbed our fences. I did midday water potential then started collecting data. Last time I had left the floor met box unlatched and the serial cable there disconnected. Plugging in the serial cable and resetting the connection in LoggerNet got the data transferred to the tower computer. I collected flux, met, camera and FD data. The serial adapter was still having issues. The laptop made the hardware connect/disconnect sounds a few times randomly so maybe the adapter hardware has an issue. I’ll try a new adapter next time. I measured the soil moisture, wells and DBH. I measured the Road well but forgot to write down the number 33.75 maybe (confirmed by regression). I serviced the zcams. Moisture Point probes ‘Under’ and ‘B’ had a bunch of bad readings. Under seems to get loose in the ground when the soil dries out and starts giving bad readings. The bottom pin on B broke off and all readings were bad. The Tower 7500: 414.9ppm CO2, 287.4mmol/m3 H2O, 99.5kPa, 14.8C, 103.2SS The Floor 7500: 427.7ppm CO2, 240.7mmol/m3 H2O, 99.6kPa, 16.1C, 101.4SS At the Floor solar panels I checked on the IRTs I had set pointing at the cal panel last time. I’m sure I cleared the grass between the IRTs and the panel last time but new yellow dandelions had grown up at least as thick as before between the them. I’m not sure the new flowers were blocking the sensors but I cleared them again. I looked at the data to see if there was enough for an inter-comparison, but it was hard to be sure. I don’t have an immediate need for these sensors so I left them running for another two weeks. I was planning to add a soil matrix potential sensor to the OSU SP1 system but ran out of time. I also want to move the PPT and SHF from the soil co2 system to this data logger. I took photos of the CR3000 and AM16/32 so hopefully I can update the program in the lab and make all the changes at once in the field. I added cable clamps to the three loose guy wire ends noted by the Beckman crew. I also checked our tensiometers on the newly adjusted guy wires. I tried both tensiometers on four different cables and made marks on the dials. One tensiometer read a little higher than the other but even trying the same tensiometer on the same line I could get 50psi difference in the readings. So not precise instruments. I left at about 16:30 |
Field Data
No tank data
Well Depth
| Date | Location | Depth (feet) |
|---|---|---|
| 2022-05-10 | VR_well | 54.9 |
| 2022-05-10 | TZ_floor | 24.95 |
| 2022-05-10 | TZ_tower | 38.75 |
| 2022-05-10 | TZ_road | 33.75 |
mode = both
Moisture Point Probes TZ
Array
(
[0] => Tower_1
[1] => Soil_Transect_4_1
[2] => Soil_Transect_3_1
[3] => Soil_Transect_2_1
[4] => Soil_Transect_1_1
[5] => SoilCO2_West_A_1
[6] => SoilCO2_West_C_1
[7] => Tower_2
[8] => Soil_Transect_4_2
[9] => Soil_Transect_3_2
[10] => Soil_Transect_2_2
[11] => Soil_Transect_1_2
[12] => SoilCO2_West_A_2
[13] => SoilCO2_West_C_2
[14] => Tower_3
[15] => Floor_South_3
[16] => Soil_Transect_4_3
[17] => Soil_Transect_3_3
[18] => Soil_Transect_2_3
[19] => Soil_Transect_1_3
[20] => SoilCO2_West_A_3
[21] => SoilCO2_West_C_3
[22] => Tower_4
[23] => Floor_South_4
[24] => Soil_Transect_4_4
[25] => Soil_Transect_3_4
[26] => Soil_Transect_2_4
[27] => Soil_Transect_1_4
[28] => SoilCO2_West_A_4
[29] => SoilCO2_West_C_4
)
| Date | DOY | Rep | Depth | Tower_1 |
Soil_Transect_4_1 |
Soil_Transect_3_1 |
Soil_Transect_2_1 |
Soil_Transect_1_1 |
SoilCO2_West_A_1 |
SoilCO2_West_C_1 |
Tower_2 |
Soil_Transect_4_2 |
Soil_Transect_3_2 |
Soil_Transect_2_2 |
Soil_Transect_1_2 |
SoilCO2_West_A_2 |
SoilCO2_West_C_2 |
Tower_3 |
Floor_South_3 |
Soil_Transect_4_3 |
Soil_Transect_3_3 |
Soil_Transect_2_3 |
Soil_Transect_1_3 |
SoilCO2_West_A_3 |
SoilCO2_West_C_3 |
Tower_4 |
Floor_South_4 |
Soil_Transect_4_4 |
Soil_Transect_3_4 |
Soil_Transect_2_4 |
Soil_Transect_1_4 |
SoilCO2_West_A_4 |
SoilCO2_West_C_4 |
Avg | Spacial Count |
Measurement Count |
|---|---|---|---|---|---|---|---|---|---|---|---|---|---|---|---|---|---|---|---|---|---|---|---|---|---|---|---|---|---|---|---|---|---|---|---|---|
| 2022-05-10 | 130 | 0 | nan | 8.3 | 5.4 | 3.6 | 7.7 | 2.1 | 14.7 | 7.1 | 14.5 | 5.7 | 16.1 | 17 | 5.4 | 18.5 | 15.8 | 16.5 | 20.4 | 11.5 | 15.1 | 22.1 | 15.9 | 22.9 | 13.4 | 23.9 | 16.5 | 14.2 | 22.5 | 34 | 16.8 | 19.6 | 21.9 | |||
| 2022-05-10 | 130 | 1 | nan | 8.3 | 2.8 | 3.3 | 8.3 | 2.1 | 16.5 | 7.1 | 14.5 | 4.5 | 16.1 | 16.7 | 5.7 | 13 | 16.1 | 18.2 | 20.1 | 12.3 | 14.8 | 20.4 | 15.9 | 19.3 | 13.1 | 24.5 | 16.2 | 13.9 | 22.8 | 33.7 | 16.8 | 22.5 | 18.8 | |||
| 2022-05-10 | 130 | Avg | 0-15cm | 0 | 0 | |||||||||||||||||||||||||||||||
| 2022-05-10 | 130 | Avg | 15-30cm | 0 | 0 | |||||||||||||||||||||||||||||||
| 2022-05-10 | 130 | Avg | 30-45cm | 0 | 0 | |||||||||||||||||||||||||||||||
| 2022-05-10 | 130 | Avg | 45-60cm | 0 | 0 |
No VR Moisture Point data found
No TZ grass heigth found
Grass Height VR 15
| Date | Height reps (cm) | Location | Average | Samp | STDEV | ||||||||||||||
|---|---|---|---|---|---|---|---|---|---|---|---|---|---|---|---|---|---|---|---|
| 2022-05-10 | 38 | 22 | 35 | 120 | 45 | 46 | 40 | 38 | 46 | 36 | 60 | 35 | 120 | 45 | 26 | GH_ALL | 50.13 | 15 | 28.72 |
Tree DBH
| Date | Tag# | Reading (mm) |
|---|---|---|
| 2022-05-10 | 1 | 21.2 |
| 2022-05-10 | 102 | 18.1 |
| 2022-05-10 | 2 | 18.0 |
| 2022-05-10 | 245 | 5.3 |
| 2022-05-10 | 3 | 21.1 |
| 2022-05-10 | 4 | 18.2 |
| 2022-05-10 | 5 | 10.4 |
| 2022-05-10 | 6 | 21.5 |
| 2022-05-10 | 7 | 12.1 |
| 2022-05-10 | 72 | 15.4 |
| 2022-05-10 | 79 | 13.8 |
Water Potential - mode: raw
| Time | Species | Tree | readings (bar) | ||
|---|---|---|---|---|---|
| 2022-05-10 13:20:00 | OAK | 102 | -10 | -19 | -13 |
| 2022-05-10 13:20:00 | OAK | 92 | -24 | -30 | -30 |
No TZ Grass Biomass data found
No TZ OakLeaves Biomass data found
No TZ PineNeedles Biomass data found
3 photos found
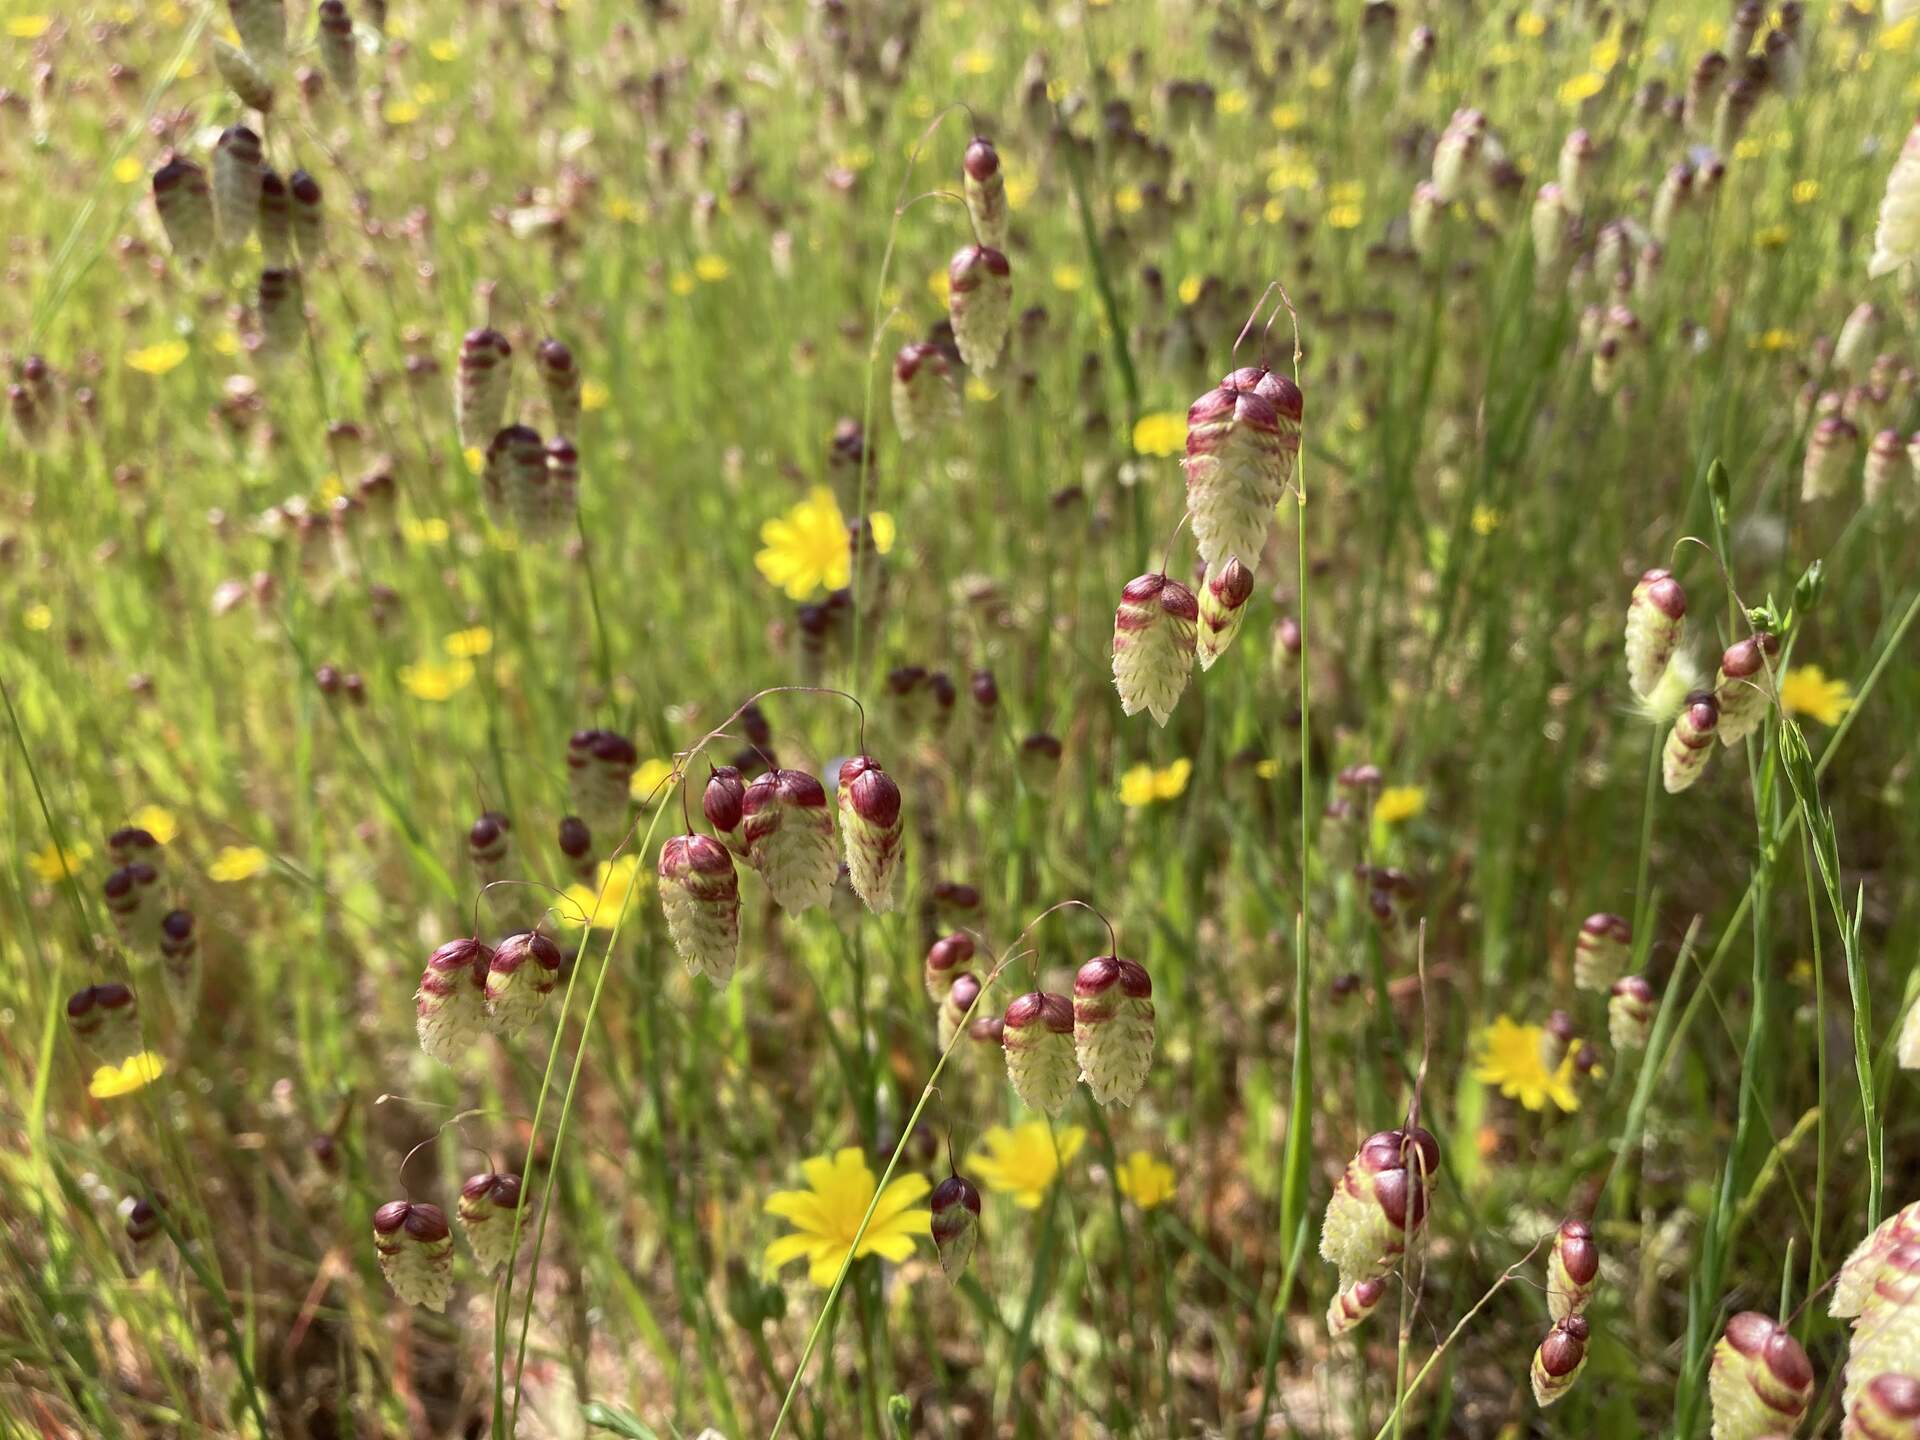
20225010TZ_QuakingGrass.jpg ( 2022-05-10 15:48:27 ) Full size: 1920x1440
A big patch of rattlesnake grass aka quaking grass (Briza maxima, invasive from Mediterranean) near southeast tower anchor

20220510TZ_LotsOfFlowers.jpg ( 2022-05-10 14:05:35 ) Full size: 1758x1410
Lots of dandelions around the Tower
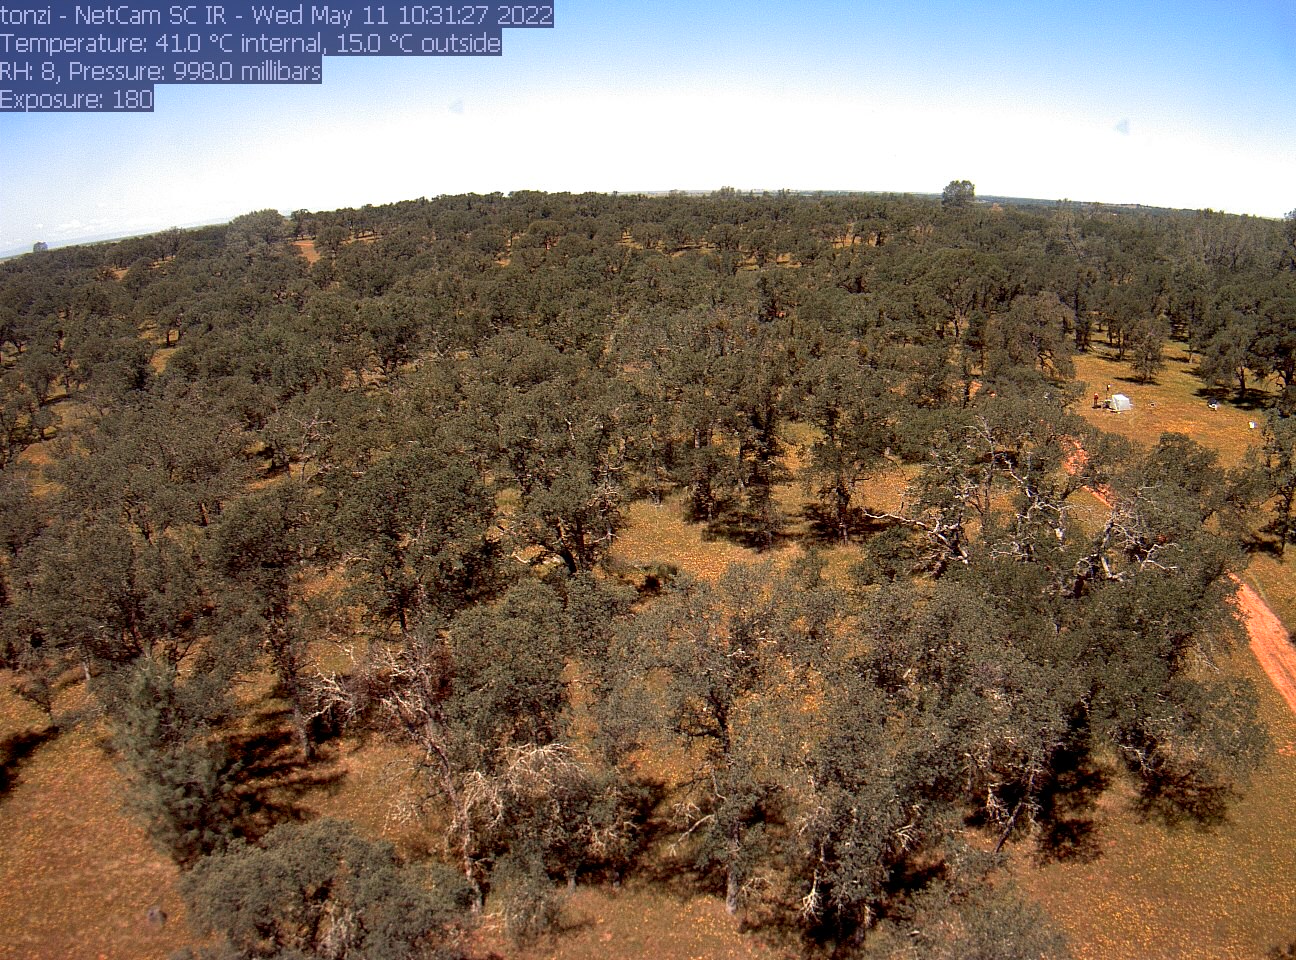
tonzi_2022_05_11_103125.jpg ( 2022-05-11 11:29:04 ) Full size: 1296x960
Trevor Keenan's lab on site taking SIF photos
16 sets found
No data found for TZ_Fenergy.
11 TZ_tmet graphs found
11 TZ_soilco2 graphs found
Can't check TZ_mixed
3 TZ_mixed graphs found
1 TZ_fflux graphs found
8 TZ_fmet graphs found
No data found for TZ_tram.
3 TZ_co2prof graphs found
1 TZ_irt graphs found
No data found for TZ_windprof.
1 TZ_tflux graphs found
2 TZ_sm graphs found
Can't check TZ_met
1 TZ_met graphs found
Can't check TZVR_mixed
8 TZ_osu graphs found
3 TZ_fd graphs found
Tonzi Z-cam data