
Field Notes
<--2022-03-24 12:30:00 | 2022-04-27 11:00:00-->Other sites visited today: Vaira
Phenocam link: Searching...
Tonzi: 2022-04-12 11:00:00 (DOY 102)
Author: Joe Verfaillie
Others: Keenan Lab
Summary: Keenan lab doing SIF, Removed calkit from Tower, cleaned up old wires on Tower, Removed Tree 1 FD chamber, Midday water potential, re-glued Phenocam window
| Tonzi 2022-04-12 I arrived at about 11:00PDT. The Keenan lab (Sophie, Nicola, Trevor, Tyler, Ann) had arrived earlier and were setting up to take SIF images of a patch of grass west of the soil co2 fence and east of LiuKang’s tree. There was a bit of rain yesterday but the ground was still mostly dry except for some small puddles in the road. The grass is turning yellow in spots. The trees are fully leafed out but a few have leaves that look slightly stunted – frost, disease, insects? There are lots of yellow dandelions blooming. I checked in with Sophie but they seemed to have everything they needed so I began work at the Tower. I removed the CalKit from the top of the Tower – the following equipment came off: CR1000 sn 23865 CNR4 sn 120788 PAR sn 212225 NDVI in sn 1049 NDVI out sn 1050 HMP155 sn T2930114 I also cleaned up the Tower some more removing some baling wire from the SMAP equipment. Two cables had half fallen out of the big plastic conduit on the southwest corner of the tower. I coiled them up where they came out of the conduit. I also removed two serial lines, MD9 coax cable, an ethernet line, and one or two more unused cables that had run up the northwest corner. The Ethernet line had a break in it close to the top where it had been bent sharply. I also re-glued the Phenocam window. The Tower 7500 read: 419.5ppm CO2, 230.5mmol/m3 H2O, 99.6kPa, 10.2C, 104.1SS The Floor 7500 read: 423.7ppm CO2, 222.5mmol/m3 H2O, 99.7kPa, 14.5C, 101.6SS I measured the soil moister and well depths, read the dendrometers, and serviced the zcams. The IRT sensors near the Floor solar panels had been disturbed by the cows. The one that usually points at the grass was pointed at the sky. The two point at the tree trunk were pointing elsewhere and at least one of their cables was chewed. I realigned them but I think I will move these to all point at the cal panel next time and then remove them – maybe Carlos wants to use them. At midday I did leaf water potential. Twigs from three trees were all about -10 Bar. One twig didn’t produce any water even at more than 20 Bar – I decided something was wrong with that twig. The Tree1 FD chamber sn FD20180048 had been reading the same CO2 for both chambers (zero flux) and I thought its solenoid was bad. But when I went to remove it, it was laying on its side, so both chambers were exposed to the air. I removed it anyway thinking that I would have noticed that it was on its side last time. In the lab it seems okay but I’ll need to set up a fancier test to really see if both chambers are okay. I was also thinking about swapping out the solar charger controller there but it will be a bit of work. That whole system needs to be mostly removed and a few things integrated with the OSU system there. Another time. I left at about 15:50 for Vaira just after the Keenan lab had headed home. |
Field Data
No tank data
Well Depth
| Date | Location | Depth (feet) |
|---|---|---|
| 2022-04-12 | TZ_floor | 25.15 |
| 2022-04-12 | TZ_road | 33.5 |
| 2022-04-12 | TZ_tower | 28.8 |
| 2022-04-12 | VR_well | 53.95 |
mode = both
Moisture Point Probes TZ
Array
(
[0] => Tower_1
[1] => Floor_South_1
[2] => Soil_Transect_4_1
[3] => Soil_Transect_3_1
[4] => Soil_Transect_2_1
[5] => SoilCO2_West_A_1
[6] => SoilCO2_West_B_1
[7] => SoilCO2_West_C_1
[8] => Tower_2
[9] => Soil_Transect_4_2
[10] => Soil_Transect_3_2
[11] => Soil_Transect_2_2
[12] => SoilCO2_West_A_2
[13] => SoilCO2_West_B_2
[14] => SoilCO2_West_C_2
[15] => Tower_3
[16] => Floor_South_3
[17] => Soil_Transect_4_3
[18] => Soil_Transect_3_3
[19] => Soil_Transect_2_3
[20] => Soil_Transect_1_3
[21] => SoilCO2_West_A_3
[22] => SoilCO2_West_B_3
[23] => SoilCO2_West_C_3
[24] => Tower_4
[25] => Floor_South_4
[26] => Soil_Transect_4_4
[27] => Soil_Transect_3_4
[28] => Soil_Transect_2_4
[29] => Soil_Transect_1_4
[30] => SoilCO2_West_A_4
[31] => SoilCO2_West_B_4
[32] => SoilCO2_West_C_4
[33] => Soil_Transect_1_1
[34] => Floor_South_2
[35] => Soil_Transect_1_2
)
| Date | DOY | Rep | Depth | Tower_1 |
Floor_South_1 |
Soil_Transect_4_1 |
Soil_Transect_3_1 |
Soil_Transect_2_1 |
SoilCO2_West_A_1 |
SoilCO2_West_B_1 |
SoilCO2_West_C_1 |
Tower_2 |
Soil_Transect_4_2 |
Soil_Transect_3_2 |
Soil_Transect_2_2 |
SoilCO2_West_A_2 |
SoilCO2_West_B_2 |
SoilCO2_West_C_2 |
Tower_3 |
Floor_South_3 |
Soil_Transect_4_3 |
Soil_Transect_3_3 |
Soil_Transect_2_3 |
Soil_Transect_1_3 |
SoilCO2_West_A_3 |
SoilCO2_West_B_3 |
SoilCO2_West_C_3 |
Tower_4 |
Floor_South_4 |
Soil_Transect_4_4 |
Soil_Transect_3_4 |
Soil_Transect_2_4 |
Soil_Transect_1_4 |
SoilCO2_West_A_4 |
SoilCO2_West_B_4 |
SoilCO2_West_C_4 |
Soil_Transect_1_1 |
Floor_South_2 |
Soil_Transect_1_2 |
Avg | Spacial Count |
Measurement Count |
|---|---|---|---|---|---|---|---|---|---|---|---|---|---|---|---|---|---|---|---|---|---|---|---|---|---|---|---|---|---|---|---|---|---|---|---|---|---|---|---|---|---|---|
| 2022-04-12 | 102 | 0 | nan | 13.2 | 8.1 | 14.1 | 13.8 | 10.9 | 19.1 | 13.5 | 8.3 | 17 | 4.8 | 16.4 | 18.2 | 12.7 | 6.3 | 14.2 | 20.7 | 20.9 | 12 | 15.9 | 23.5 | 19 | 20.1 | 21.5 | 14.8 | 28.8 | 25.4 | 15.3 | 19.3 | 38.8 | 19.6 | 25.1 | 15.6 | 18.5 | ||||||
| 2022-04-12 | 102 | 1 | nan | 13.8 | 10.6 | 14.4 | 13.2 | 10.6 | 19.4 | 13.2 | 7.4 | 16.7 | 7.5 | 16.4 | 17.5 | 13.3 | 6.3 | 14.2 | 19.8 | 21.5 | 13.4 | 16.5 | 23.5 | 19.3 | 20.4 | 20.9 | 14.3 | 28.8 | 25.2 | 15.6 | 19.9 | 39.1 | 19.6 | 24.8 | 14.8 | 17.9 | 5 | 12.4 | 9 | |||
| 2022-04-12 | 102 | 2 | nan | 19.3 | 19.3 | 5 | 9.3 | |||||||||||||||||||||||||||||||||||
| 2022-04-12 | 102 | Avg | 0-15cm | 0 | 0 | |||||||||||||||||||||||||||||||||||||
| 2022-04-12 | 102 | Avg | 15-30cm | 0 | 0 | |||||||||||||||||||||||||||||||||||||
| 2022-04-12 | 102 | Avg | 30-45cm | 0 | 0 | |||||||||||||||||||||||||||||||||||||
| 2022-04-12 | 102 | Avg | 45-60cm | 0 | 0 |
No VR Moisture Point data found
No TZ grass heigth found
Grass Height VR 14
| Date | Height reps (cm) | Location | Average | Samp | STDEV | |||||||||||||
|---|---|---|---|---|---|---|---|---|---|---|---|---|---|---|---|---|---|---|
| 2022-04-12 | 10 | 14 | 25 | 26 | 14 | 40 | 14 | 40 | 10 | 26 | 7 | 20 | 30 | 40 | GH_ALL | 22.57 | 14 | 11.28 |
Tree DBH
| Date | Tag# | Reading (mm) |
|---|---|---|
| 2022-04-12 | 1 | 19.9 |
| 2022-04-12 | 102 | 15.8 |
| 2022-04-12 | 2 | 17.1 |
| 2022-04-12 | 245 | 4.6 |
| 2022-04-12 | 3 | 20.4 |
| 2022-04-12 | 4 | 17.0 |
| 2022-04-12 | 5 | 9.9 |
| 2022-04-12 | 6 | 20.4 |
| 2022-04-12 | 7 | 10.5 |
| 2022-04-12 | 72 | 13.9 |
| 2022-04-12 | 79 | 13.1 |
Water Potential - mode: raw
| Time | Species | Tree | readings (bar) | |
|---|---|---|---|---|
| 2022-04-12 13:43:00 | OAK | 102 | -7 | -7 |
| 2022-04-12 13:43:00 | OAK | 228 | -10 | -9 |
| 2022-04-12 13:43:00 | OAK | 92 | -13 | -11 |
No TZ Grass Biomass data found
No TZ OakLeaves Biomass data found
No TZ PineNeedles Biomass data found
3 photos found
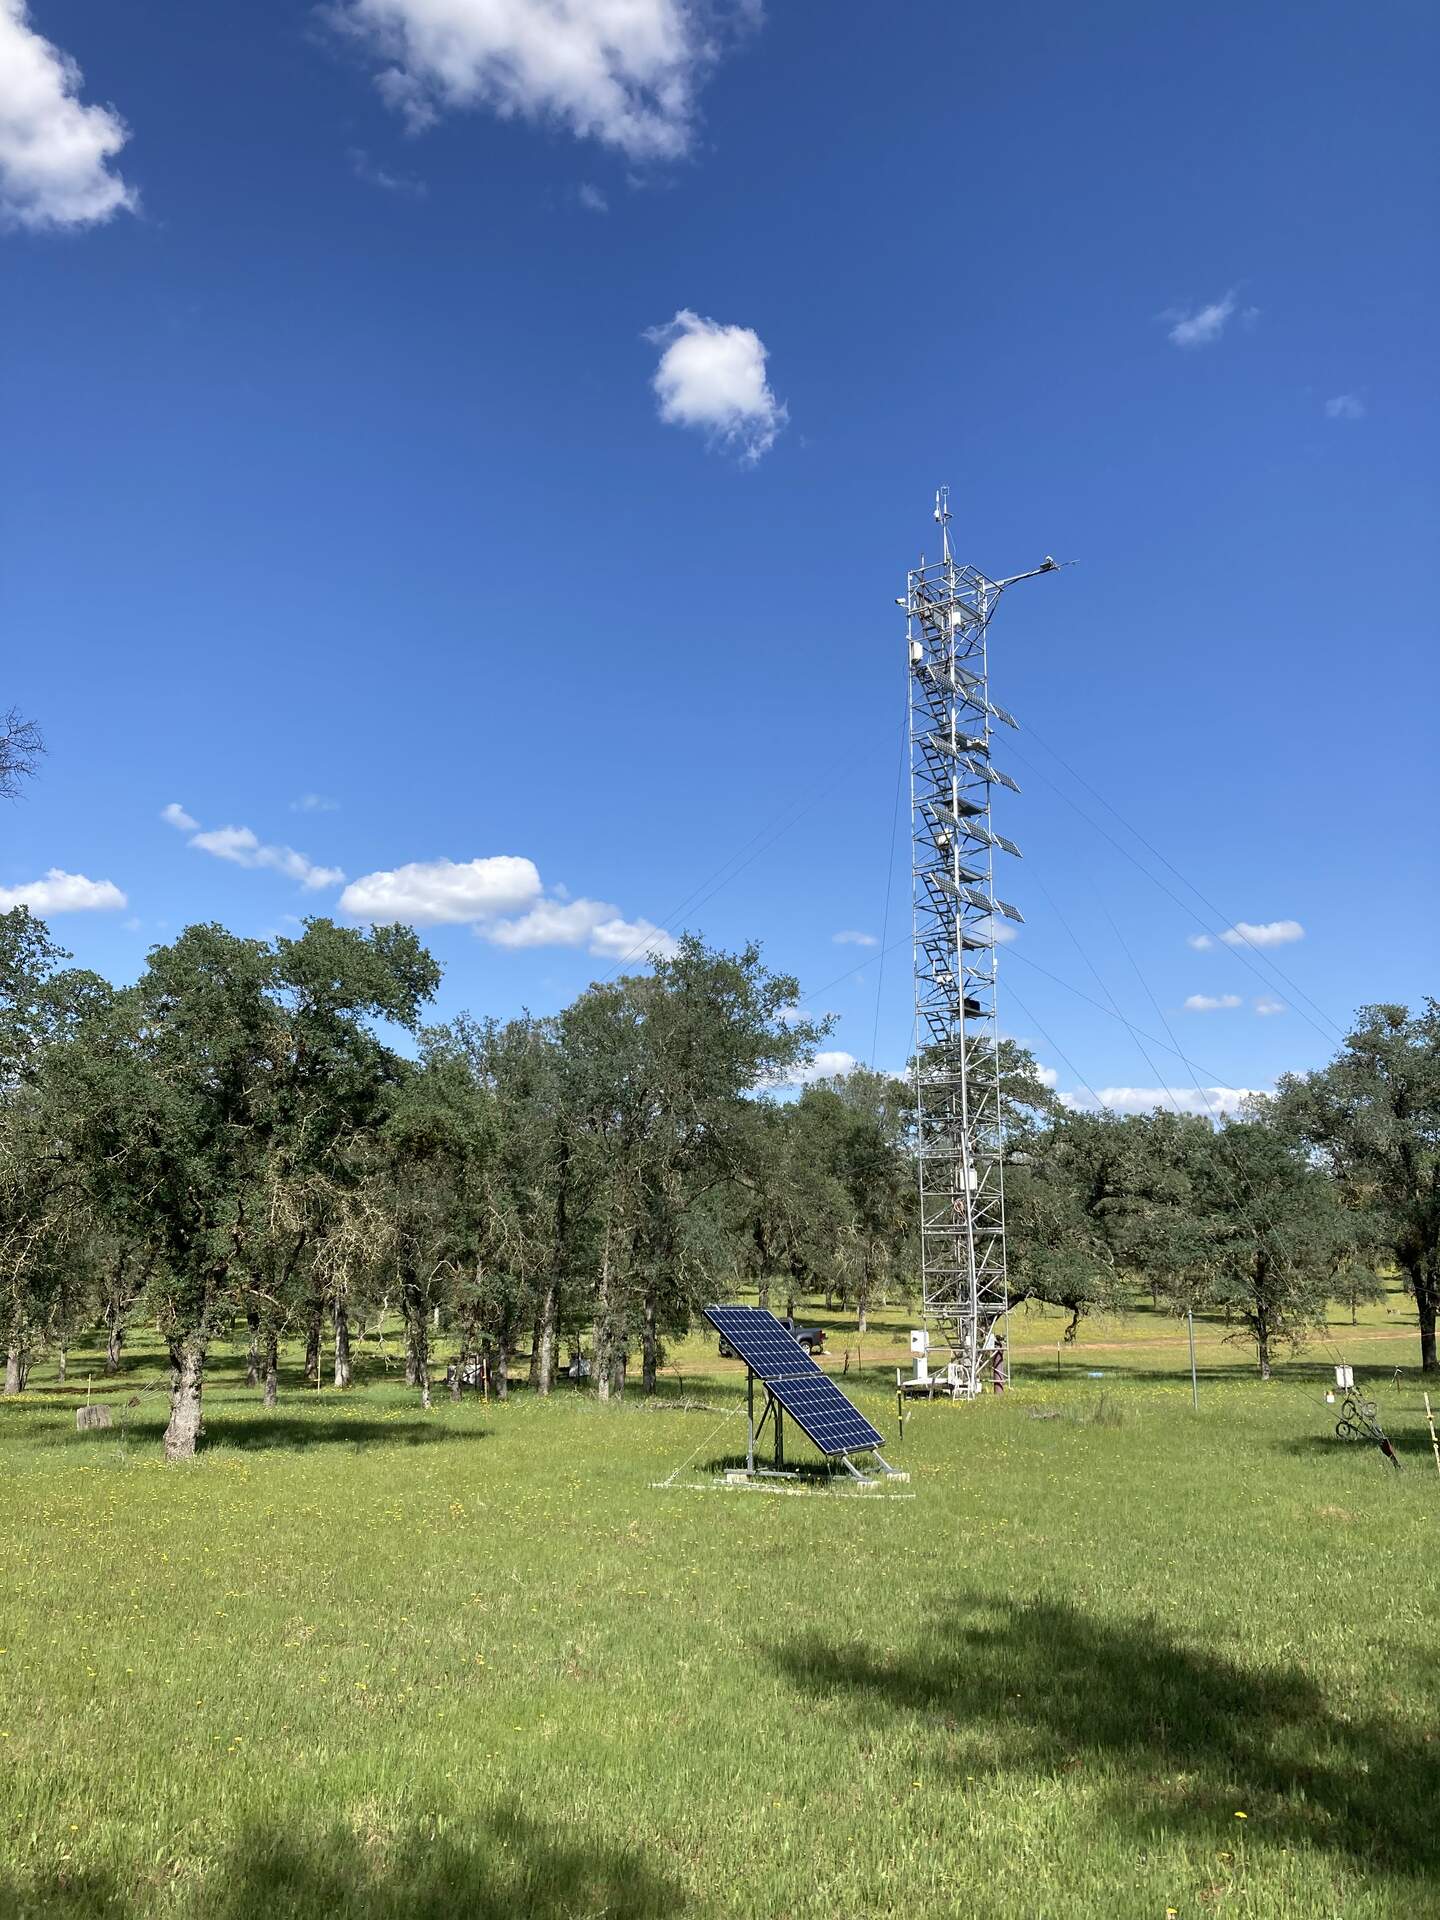
20220412TZ_Tower.jpg ( 2022-04-12 15:34:22 ) Full size: 1440x1920
Nice spring day at Tonzi even if the grass is starting to turn yellow

20220412TZ_KeenanLabSIF.jpg ( 2022-04-12 13:49:37 ) Full size: 1920x1440
Trevor Keenan's lab using a SIF camera
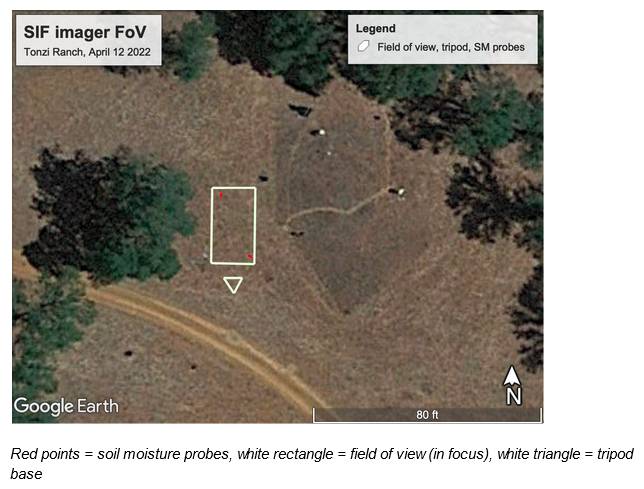
20220412TZ_SIFex.jpg ( 2022-04-12 00:00:00 ) Full size: 644x489
Map show location of the SIF experiment by Keenan Lab
16 sets found
No data found for TZ_Fenergy.
11 TZ_tmet graphs found
11 TZ_soilco2 graphs found
Can't check TZ_mixed
3 TZ_mixed graphs found
1 TZ_fflux graphs found
8 TZ_fmet graphs found
No data found for TZ_tram.
3 TZ_co2prof graphs found
1 TZ_irt graphs found
No data found for TZ_windprof.
1 TZ_tflux graphs found
2 TZ_sm graphs found
Can't check TZ_met
1 TZ_met graphs found
Can't check TZVR_mixed
8 TZ_osu graphs found
3 TZ_fd graphs found
Tonzi Z-cam data