
Field Notes
<--2022-01-06 09:35:00 | 2022-02-03 09:05:00-->Other sites visited today: Vaira | Tonzi
Phenocam link: Searching...
Hill Slough: 2022-01-19 09:40:00 (DOY 19)
Author: Joe Verfaillie
Others:
Summary: Updated Pi-cam program, updated CR1000 program - conductivity still wonky, 7700 optics RH high, tried to fix by adding putty to TC module.
| Hill Slough 2022-01-19 I arrived at about 9:40am. It was cool and still with fog just lifting. There was a bunch of corn kernels on the ground near the parking spot and on the beginning of our boardwalk. There were about 10 grackles eating the corn and hanging out on the solar panels while I worked on the tower. Tide was low and the staff gauge read 4.24ft I down loaded the Pi-cam images then I used WinSCP to download a copy of the existing program and upload the new version that supports dawn to dusk photos and FWB photos (R=1.4, B=1.3). I had to restart to get the new version to run and then restart again after I changed its settings, but it all seemed okay. The 7500 read: 446.3ppm CO2, 466.5mmol H2O, 102.3kPa, 9.5C, 99.1SS – 100.1 after cleaning The 7700 read: 2.1ppm CH4, 41.0RSSI – 69.6 after cleaning There were dew covered strands of spider silk on the eddy sensors that I cleaned off. The reservoir was nearly full – good because I didn’t bring more DI water. The bird spikes on the 7500 are broken and need to be replaced. The 7700 optics RH was 43%. I removed the desiccant bottle and it was all pink. I removed the TC unit and think it was missing an o-ring that might be letting humidity into the head. I filled a groove with some putty and was putting it back in when I dropped it into the water below. I didn’t have waders or boot so I took my shoes and socks off to retrieve the TC unit – good thing tide was low. I thoroughly dried it off with rags and canned air before reinstalling it. I didn’t have any fresh desiccant in the blue bag but I found some blue silica gel in the water level tube. I filled the 7700 bottle with that and put it back. By that time, the optics RH had risen to 49%. Let’s hope the putty improves the seal and the desiccant does its job. I collected the met data then uploaded a new program. The new program fixes a range limitation on the HYDROS21 conductivity. The 10sec conductivity numbers were 88000 to 120000 uS/cm but were being truncated to 7999 because of the FP2 number format. After changing the output format to IEEE it was saving the same range. However those values are way too high – values of 8800 uS/cm might be okay. We may be able to take some manual measurements and/or use some standards to check the sensor. The new met program also has some calculations for Carlos’s ET calculations. The calculations are currently using a fixed pressure number since we don’t have a pressure sensor on the data logger but I thought we can see what the numbers look like. I cleaned the radiometers – they all had some dew on them. I did not download the miniDot data. I put my shoes and socks back on and left at about 10:40 for Tonzi. |
1 photos found
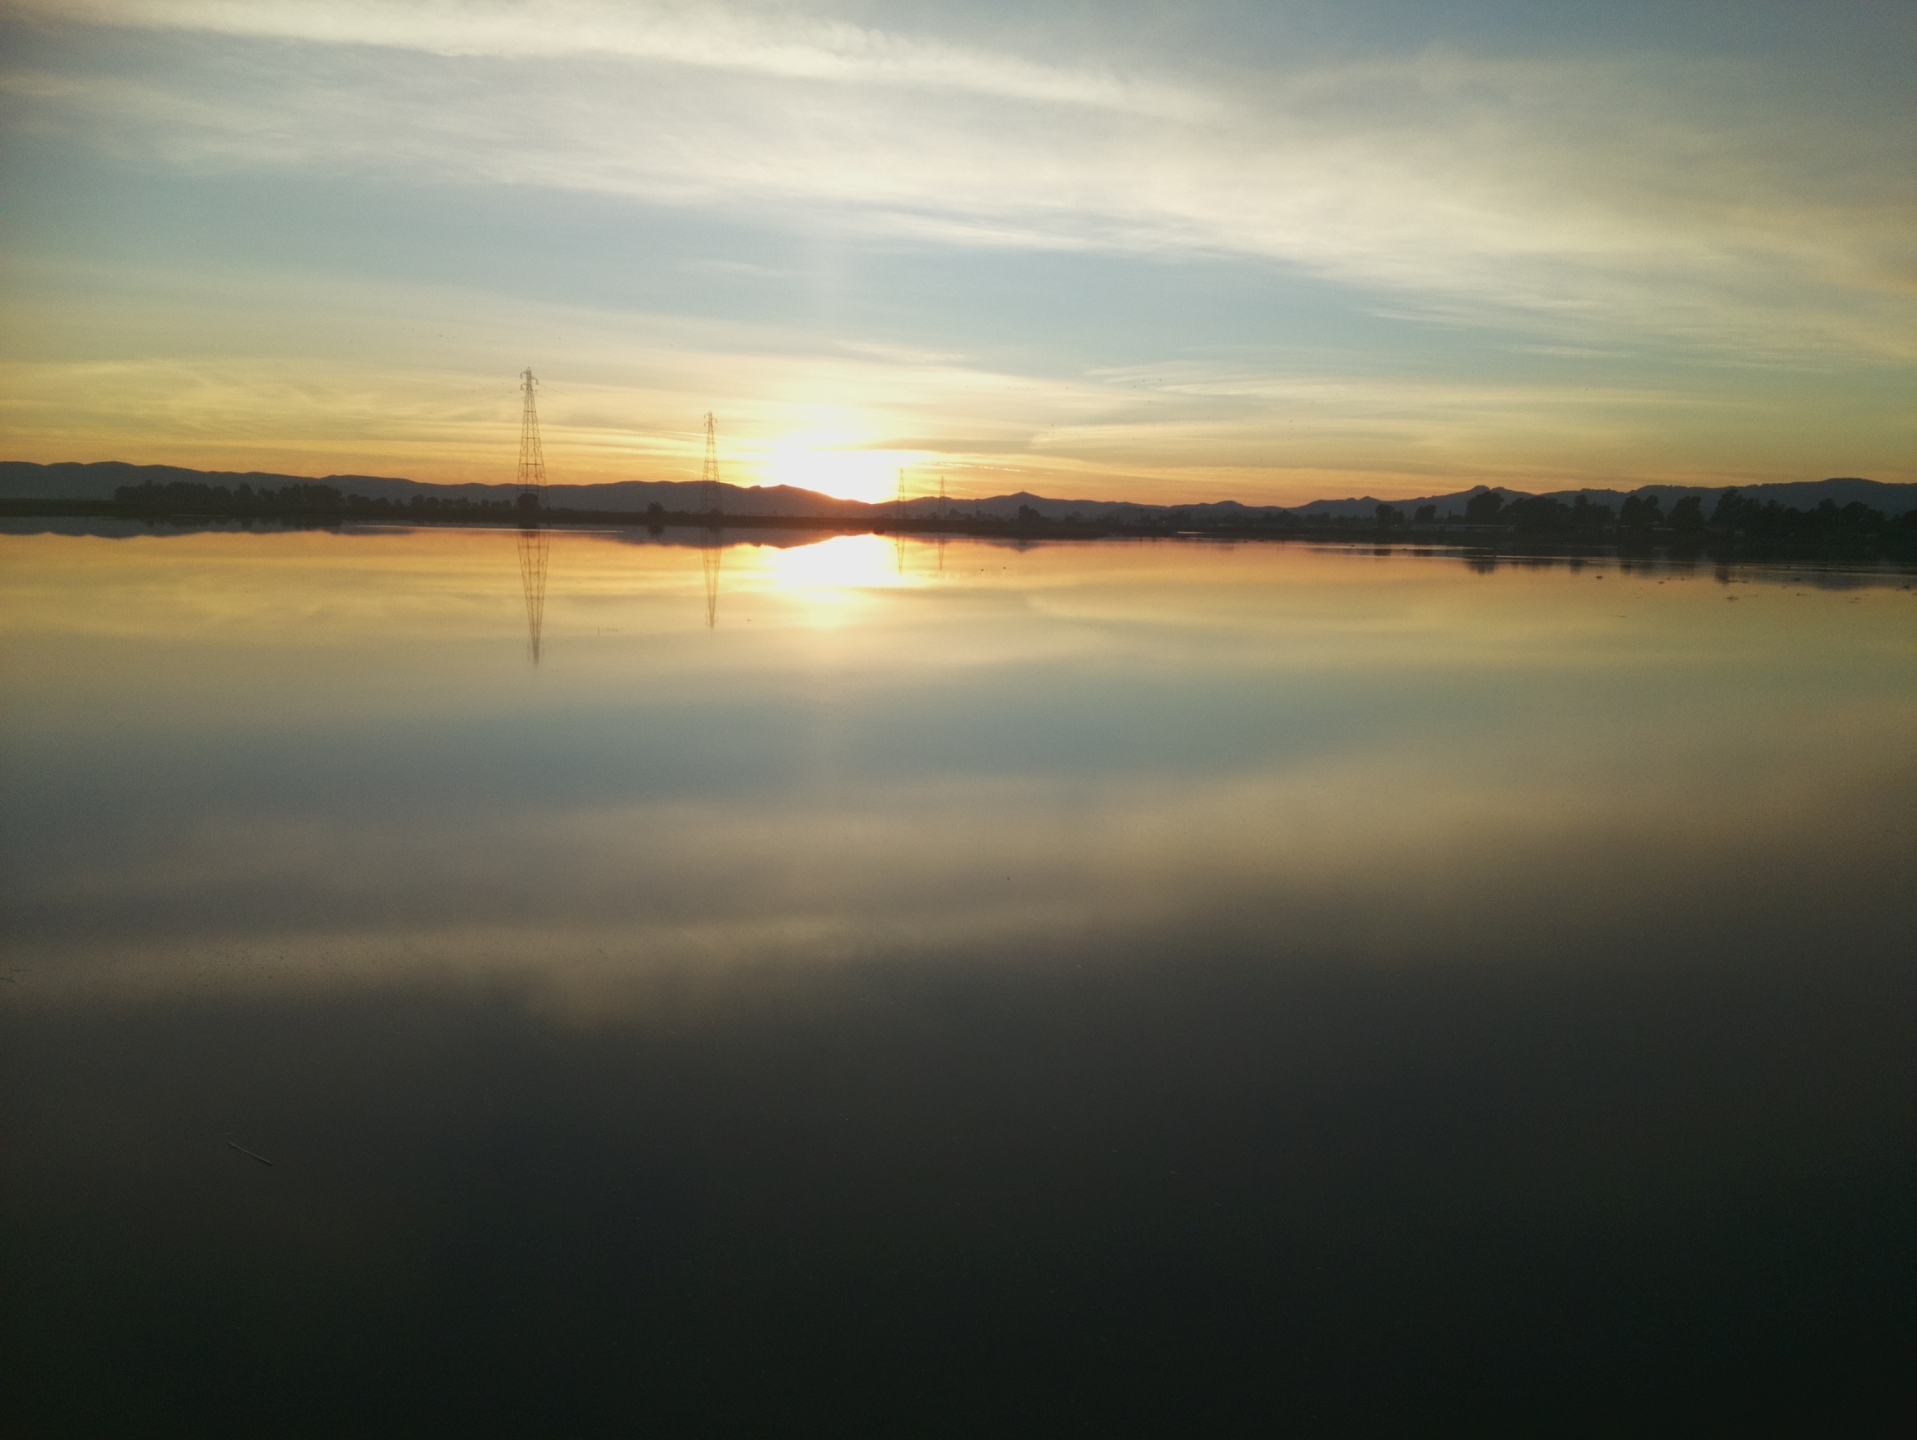
HS_picam_20220119_1715.jpg ( 2022-01-19 17:15:05 ) Full size: 1917x1440
Sunset and water
4 sets found
21 HS_met graphs found
4 HS_flux graphs found
1 HS_cam graphs found
Can't check HS_Processed
2 HS_Processed graphs found