Field Notes
<--2021-12-14 09:55:00 | 2022-01-19 09:40:00-->Other sites visited today: Tonzi | Vaira
Phenocam link: Searching...
Hill Slough: 2022-01-06 09:35:00 (DOY 6)
Author: Daphne Szutu
Others: Dennis
Summary: Regular data collection/cleaning, foggy, changed 7700 optics desiccant again, raised miniDOT slightly
| 2022-01-06 Hill Slough Dennis and I arrived at 9:35 PST. It was foggy and cold with not much wind. There were lots of geese and other birds around. Dennis identified two tundra swans flying by with the whistling sound their wings make as they flap. It was relatively low tide and the steps up to the boardwalk were easy to access. The staff gauge read 4.88 feet at 9:48 PST. The staff gauge was slightly brown up to the 6’ mark. Dennis cleaned flux and rad sensors. He could only spin the radiometer boom to the east because of the tight pivot point, not to the west as we usually do. The 7500 lower window had a lot of condensation. It was hard to get the 7700 RSSI much higher than 50 because of all the mist in the air. I downloaded met, cam, and USB GHG data. I used a second laptop to download the picam while I downloaded the rest of the data on my regular laptop. After downloading the data, I sent a new met datalogger program that had the correct headings for the METER cond-temp-depth sensor. The old column headings were conductivity, temp, depth. The new columns headings are depth, temp, conductivity. I will make sure the data and column headers match before uploading it to the database. The 7700 Optics RH was at 45% and there was a red warning to replace the desiccant. I changed out the bottle of pink silica gel for a bottle of fresh, blue drierite. I also added a teeny amount of lubricant to the o-rings on the plug that holds the desiccant bottle in place. I downloaded the miniDOT data and swapped its desiccant. The miniDOT seemed to be deployed a bit low because there was slack in the cable and you could see it was slightly tilted underwater, not vertical. I raised it up slightly. Dennis swapped the desiccant for the water level sensor and refilled the wash reservoir, which had been ½ full. LI-7500 readings: CO2 2000ppm --> 450 after cleaning H2O 30000ppm --> 500 after cleaning T 9.2C P 101.8kPa SS 0--> 100 after cleaning LI7700 readings: CH4 2.5ppm RSSI 42 --> 56 after cleaning We left at 10:10 PST. |
1 photos found

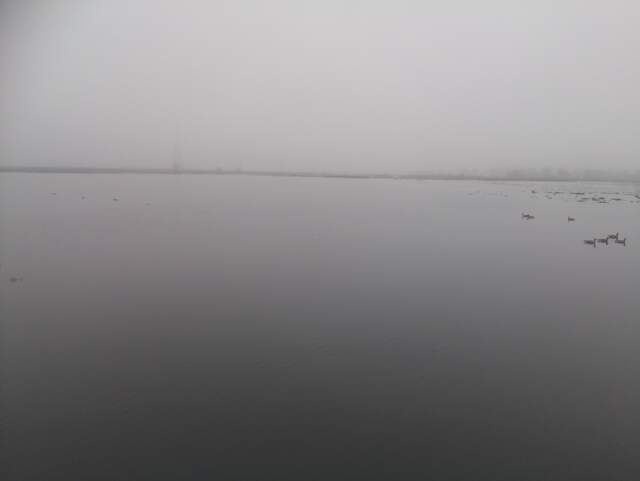
HS_picam_20220106_0815.jpg ( 2022-01-06 08:15:05 ) Full size: 1917x1440
Fog and birds on the water
4 sets found
21 HS_met graphs found
4 HS_flux graphs found
1 HS_cam graphs found
Can't check HS_Processed
2 HS_Processed graphs found

