
Field Notes
<--2022-01-06 11:50:00 | 2022-02-09 13:30:00-->Other sites visited today: Hill Slough | Vaira
Phenocam link: Searching...
Tonzi: 2022-01-19 14:00:00 (DOY 19)
Author: Joe Verfaillie
Others:
Summary: Standard field work, Ethernet line to Tower computer not working, OSU SP1 needs power.
| Tonzi 2022-01-19 I arrived at about 14:00. It was clear sunny and cool. The breeze from earlier had died. The pond is pretty close to completely full and there are puddles in the road. The grass might be a bit longer here than Vaira but there are no cows. I checked on the tower. It seems like there have been no more power outages but then it’s been mostly sunny. The Stardot camera had reset its clock just this morning but I’m not sure that is totally related to the overall power situation. The Ethernet connection between the LattePanda and the rest of the tower is not working. I replaced the connector at the computer but neither the LattePanda nor the laptop could see the rest of the network. I guess I should buy those Ethernet line testers. With the Ethernet down I had to collect the data directly from the tower met CR1000 and the co2 profile CR6. I noticed that the SMAP battery boxes about halfway up the tower were full or rain water again. Usually I take the batteries out, dump the water and put the batteries back. This time I thought I would be smarter and I just poked holes in the bottom of the boxes with my knife. The water started to stream out and as the streams hit the mesh boardwalks at each level it broke apart into a wider and wider spray. At the bottom of the tower it was like it was raining. Two weeks ago when the tower lost a little bit of data due to low solar power, OSU SP2 lost major amounts of data. I use the load tester on its battery today and it’s pretty much dead. If it is sunny we will get daytime data. I was planning to hook it up to the Tower’s power but ran out of time today – next time. I collected the fluxes, met, camera images, and FD data. I measured the wells, DBH and soil moisture. The understory Moisture Point probe that I though was dead seems to have reasonable number today and last time when Dennis measured it. Hmm? The Road Well lithium power pack had died just after last visit. I replaced it. I need to add solar power to keep it running or just swap it every time – seems it runs about 40days per charge (used to be longer 60-70days). I serviced the zcams. Zcam 1 has reset its clock. These too seem to be running for shorter times on new batteries. I put the repaired power cable back on the solar panel for the soil co2 fence charger. It seemed to be working when I turned it on. I left at about 17:10 just as the sun was setting. |
Field Data
No tank data
Well Depth
| Date | Location | Depth (feet) |
|---|---|---|
| 2022-01-19 | VR_well | 52.55 |
| 2022-01-19 | TZ_floor | 26.1 |
| 2022-01-19 | TZ_road | 37.95 |
| 2022-01-19 | TZ_tower | 30.35 |
| 2022-01-19 | HS | 4.24 |
mode = both
Moisture Point Probes TZ
Array
(
[0] => Tower_1
[1] => Floor_South_1
[2] => Soil_Transect_4_1
[3] => Soil_Transect_3_1
[4] => Soil_Transect_2_1
[5] => Soil_Transect_1_1
[6] => SoilCO2_West_A_1
[7] => SoilCO2_West_B_1
[8] => SoilCO2_West_C_1
[9] => Tower_2
[10] => Floor_South_2
[11] => Soil_Transect_4_2
[12] => Soil_Transect_3_2
[13] => Soil_Transect_2_2
[14] => Soil_Transect_1_2
[15] => SoilCO2_West_A_2
[16] => SoilCO2_West_B_2
[17] => SoilCO2_West_C_2
[18] => Tower_3
[19] => Floor_South_3
[20] => Soil_Transect_4_3
[21] => Soil_Transect_3_3
[22] => Soil_Transect_2_3
[23] => Soil_Transect_1_3
[24] => SoilCO2_West_A_3
[25] => SoilCO2_West_B_3
[26] => SoilCO2_West_C_3
[27] => Tower_4
[28] => Floor_South_4
[29] => Soil_Transect_4_4
[30] => Soil_Transect_3_4
[31] => Soil_Transect_2_4
[32] => Soil_Transect_1_4
[33] => SoilCO2_West_A_4
[34] => SoilCO2_West_B_4
[35] => SoilCO2_West_C_4
)
| Date | DOY | Rep | Depth | Tower_1 |
Floor_South_1 |
Soil_Transect_4_1 |
Soil_Transect_3_1 |
Soil_Transect_2_1 |
Soil_Transect_1_1 |
SoilCO2_West_A_1 |
SoilCO2_West_B_1 |
SoilCO2_West_C_1 |
Tower_2 |
Floor_South_2 |
Soil_Transect_4_2 |
Soil_Transect_3_2 |
Soil_Transect_2_2 |
Soil_Transect_1_2 |
SoilCO2_West_A_2 |
SoilCO2_West_B_2 |
SoilCO2_West_C_2 |
Tower_3 |
Floor_South_3 |
Soil_Transect_4_3 |
Soil_Transect_3_3 |
Soil_Transect_2_3 |
Soil_Transect_1_3 |
SoilCO2_West_A_3 |
SoilCO2_West_B_3 |
SoilCO2_West_C_3 |
Tower_4 |
Floor_South_4 |
Soil_Transect_4_4 |
Soil_Transect_3_4 |
Soil_Transect_2_4 |
Soil_Transect_1_4 |
SoilCO2_West_A_4 |
SoilCO2_West_B_4 |
SoilCO2_West_C_4 |
Avg | Spacial Count |
Measurement Count |
|---|---|---|---|---|---|---|---|---|---|---|---|---|---|---|---|---|---|---|---|---|---|---|---|---|---|---|---|---|---|---|---|---|---|---|---|---|---|---|---|---|---|---|
| 2022-01-19 | 19 | 0 | nan | 37.6 | 27.9 | 10.9 | 26.1 | 25 | 15.9 | 33.5 | 32 | 31.1 | 35.6 | 37.8 | 28 | 32.9 | 31.9 | 21.6 | 28.9 | 24.3 | 31 | 34.3 | 43.1 | 32.1 | 32.9 | 35.4 | 34.3 | 34.1 | 41.3 | 38 | 42.3 | 50.9 | 34 | 42.5 | 47.7 | 36.5 | 45.7 | 48.6 | 47.7 | |||
| 2022-01-19 | 19 | 1 | nan | 38.4 | 27.9 | 15.3 | 24.1 | 23.8 | 32.3 | 32.6 | 30.5 | 35 | 38.4 | 28 | 31 | 22.2 | 28.6 | 25.2 | 30.7 | 33.5 | 43.3 | 31.8 | 35.2 | 34.3 | 35.7 | 41 | 38.5 | 43.4 | 54.6 | 34.5 | 47 | 36.8 | 44.5 | 48.3 | 47.1 | |||||||
| 2022-01-19 | 19 | 2 | nan | 20 | 22.2 | 34.1 | 36.8 | |||||||||||||||||||||||||||||||||||
| 2022-01-19 | 19 | Avg | 0-15cm | 0 | 0 | |||||||||||||||||||||||||||||||||||||
| 2022-01-19 | 19 | Avg | 15-30cm | 0 | 0 | |||||||||||||||||||||||||||||||||||||
| 2022-01-19 | 19 | Avg | 30-45cm | 0 | 0 | |||||||||||||||||||||||||||||||||||||
| 2022-01-19 | 19 | Avg | 45-60cm | 0 | 0 |
No VR Moisture Point data found
No TZ grass heigth found
Grass Height VR 13
| Date | Height reps (cm) | Location | Average | Samp | STDEV | ||||||||||||
|---|---|---|---|---|---|---|---|---|---|---|---|---|---|---|---|---|---|
| 2022-01-19 | 15 | 4 | 10 | 12 | 13 | 12 | 14 | 4 | 4 | 6 | 7 | 3 | 10 | GH_FENCED | 8.77 | 13 | 4.12 |
Tree DBH
| Date | Tag# | Reading (mm) |
|---|---|---|
| 2022-01-19 | 1 | 17.4 |
| 2022-01-19 | 102 | 17.2 |
| 2022-01-19 | 2 | 15.3 |
| 2022-01-19 | 245 | 4.5 |
| 2022-01-19 | 3 | 20.2 |
| 2022-01-19 | 4 | 16.0 |
| 2022-01-19 | 5 | 8.9 |
| 2022-01-19 | 6 | 20.3 |
| 2022-01-19 | 7 | 9.6 |
| 2022-01-19 | 72 | 13.2 |
| 2022-01-19 | 79 | 13.0 |
No water potential data found
No TZ Grass Biomass data found
No TZ OakLeaves Biomass data found
No TZ PineNeedles Biomass data found
3 photos found
20220118TZ_SunGoingDown.jpg ( 2022-01-19 17:12:15 ) Full size: 1920x899
The sun going down
20220119TZ_Sunset.jpg ( 2022-01-19 17:10:35 ) Full size: 1920x1440
Sunset over Tonzi’s pond
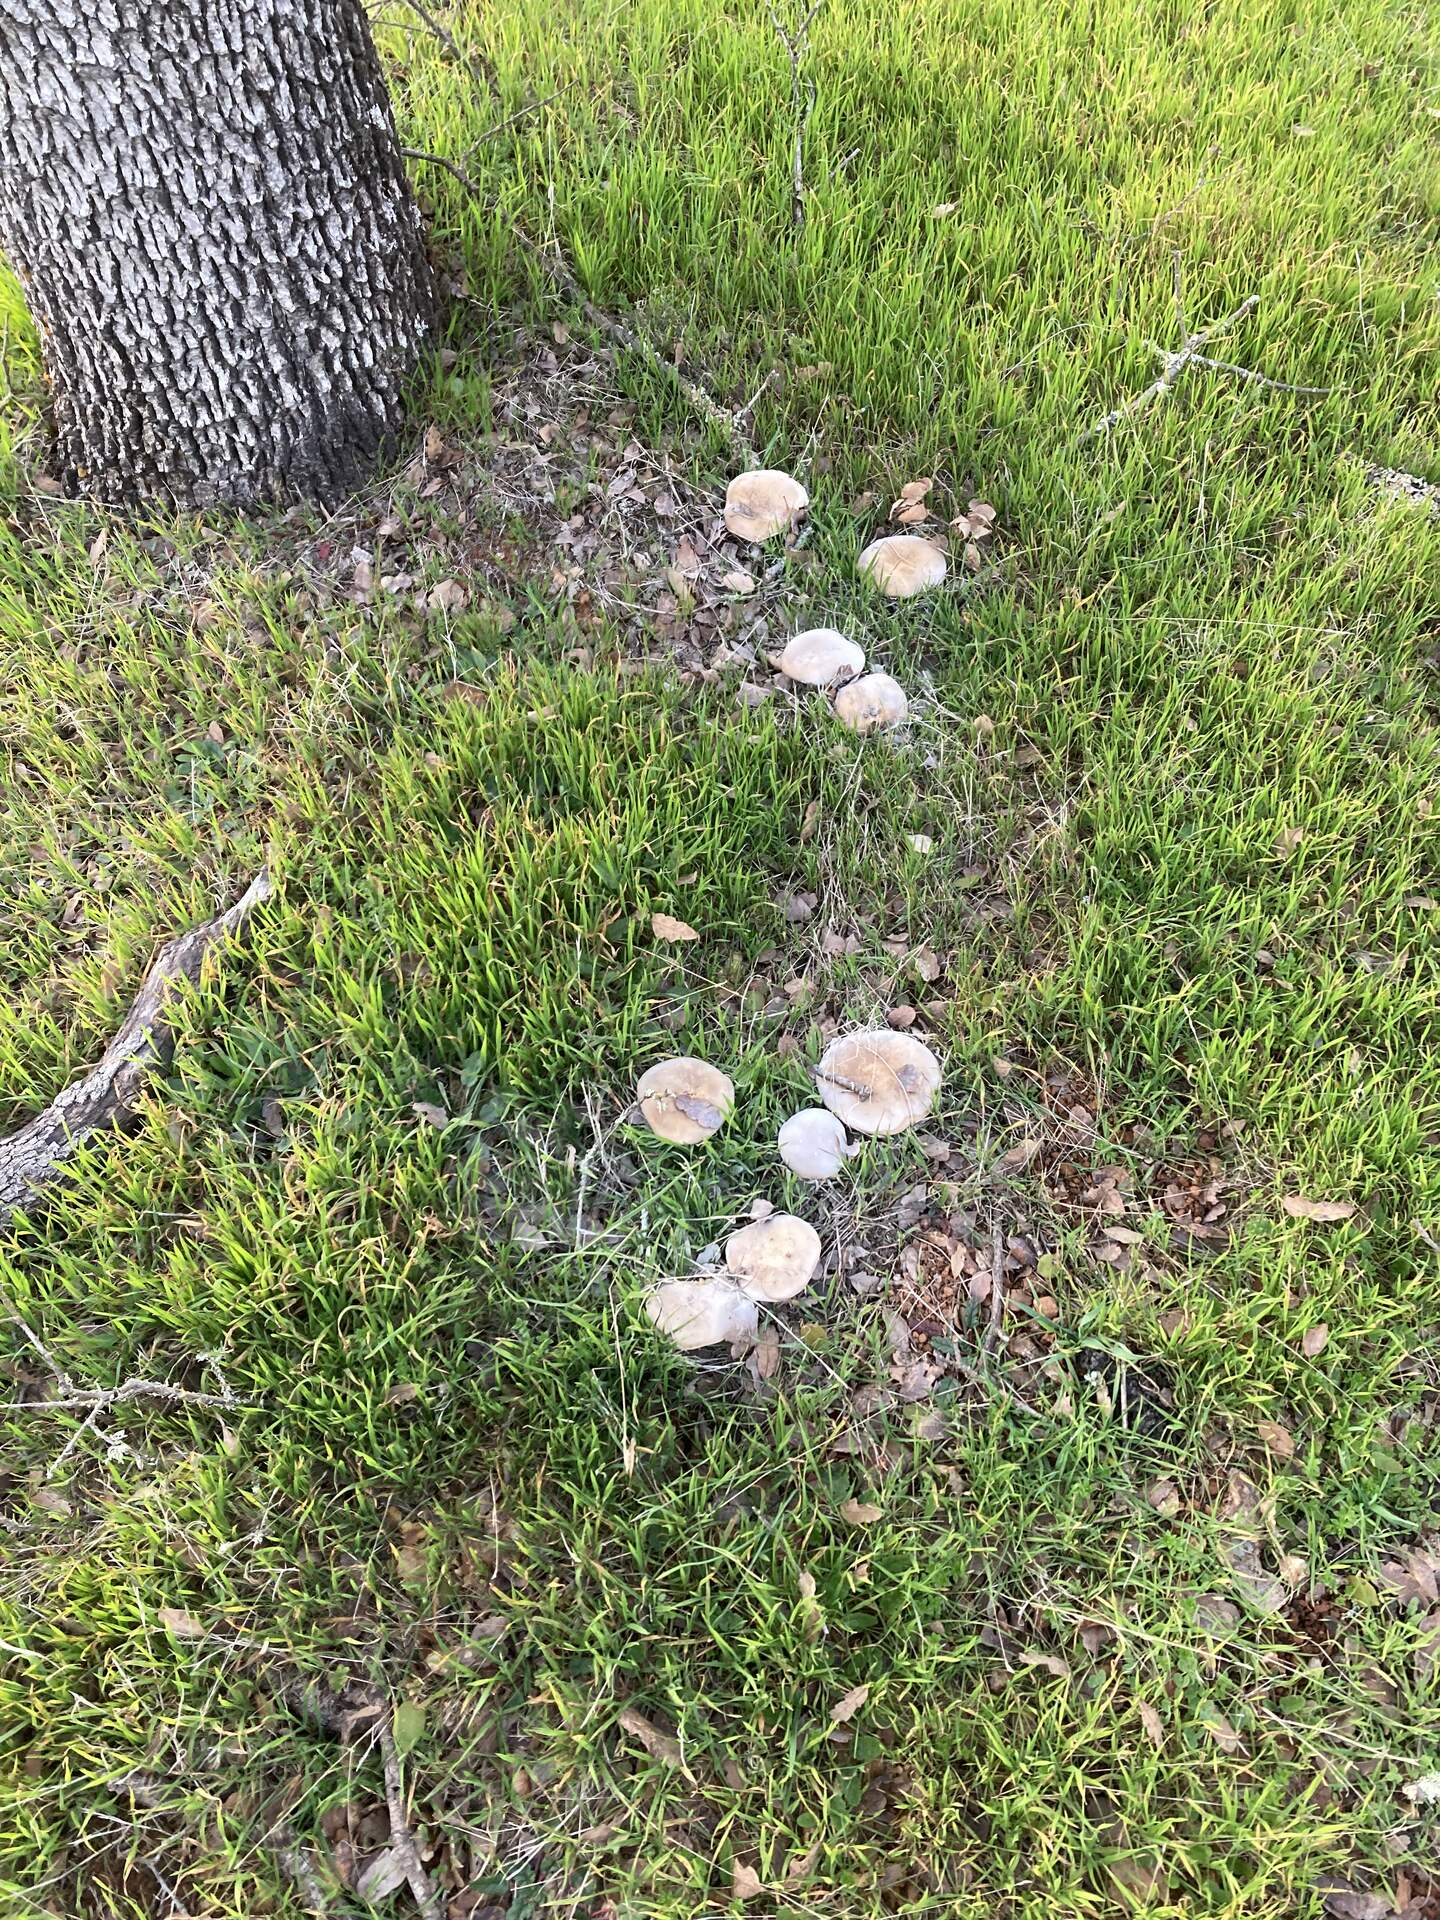
20220119TZ_Mushrooms.jpg ( 2022-01-19 16:46:23 ) Full size: 1440x1920
A bunch of mushrooms coming up around this tree. Maybe it has died.
16 sets found
No data found for TZ_Fenergy.
11 TZ_tmet graphs found
11 TZ_soilco2 graphs found
Can't check TZ_mixed
3 TZ_mixed graphs found
1 TZ_fflux graphs found
8 TZ_fmet graphs found
No data found for TZ_tram.
3 TZ_co2prof graphs found
1 TZ_irt graphs found
No data found for TZ_windprof.
1 TZ_tflux graphs found
2 TZ_sm graphs found
Can't check TZ_met
1 TZ_met graphs found
Can't check TZVR_mixed
8 TZ_osu graphs found
3 TZ_fd graphs found
Tonzi Z-cam data