
Field Notes
<--2021-08-04 15:55:00 | 2021-09-02 09:50:00-->Other sites visited today: Hill Slough | Bouldin Corn | Bouldin Alfalfa | West Pond | East End | Sherman Wetland
Phenocam link: Searching...
Mayberry: 2021-08-17 14:30:00 (DOY 229)
Author: Daphne Szutu
Others: Joe, Ariane
Summary: Regular data collection/cleaning, caterpillars are here!, set up radiometer cal kit, miniDOT has a few barnacles, changed Stardot camera enclosure mount, tightened sonic cable
| 2021-08-17 Mayberry Joe, Ariane, and I arrived at 14:30 PDT. It was warm with mostly clear skies but an apparent band of wildfire smoke near the horizon. The caterpillars have (visibly) arrived at Mayberry! Some of the cattails near the tower look well chewed, but the damage is not as widespread yet as we see at SW. The staff gauge read 71 cm. Ari and Joe cleaned flux and rad sensors and put up the rad cal kit. Datalogger and sensors added: CR1000 sn 23865 CNR4 sn 121038 PAR sn 060831 NDVI in sn 1049 NDVI out sn 1050 I downloaded met, camera, USB GHG, and miniDOT data. I moved the Stardot photos from the CF card to the laptop and replaced the card in the datalogger. I swapped in fresh desiccant for the miniDOT and water level sensors and put in new lithium batteries for the miniDOT. The MiniDOT has a few (more than a few) barnacles growing on it. The copper screen is falling apart and it looks like a coating is coming off the sensor window. We should swap it out for maintenance with a fresh sensor next time. The conductivity has been increasing since last summer from 1 to 6 mS. Ari used a rag to clean the green hairy algae growing on the miniDOT and eosGP sensors. I topped off the wash reservoir. I downloaded the FD data and cleared its memory. Joe changed the mount of the Stardot camera to the outside side of the wooden post so that the Canon enclosure can swing up and down freely. The new Stardot view looked fine. I changed the Stardot time +2min to match the laptop time. We will set up the Picam again during senescence after we make some programming upgrades. The sonic cable was loose at the sonic (again) so Joe tightened it. LI-7500 readings: CO2 398ppm H2O 760ppm T 28.4C P 100.3kPa SS 98-->100 after cleaning LI7700 readings: CH4 2.0ppm RSSI 63--> 79 after cleaning We left at 15:20 PDT. |
3 photos found

20210817MB_RadiometerCompare.jpg ( 2021-08-17 15:10:32 ) Full size: 1920x1440
Radiometer inter-comparison begun

20210817MB_Barnicles.jpg ( 2021-08-17 14:53:19 ) Full size: 1440x1920
Lots of barnacles growing all over the miniDot.
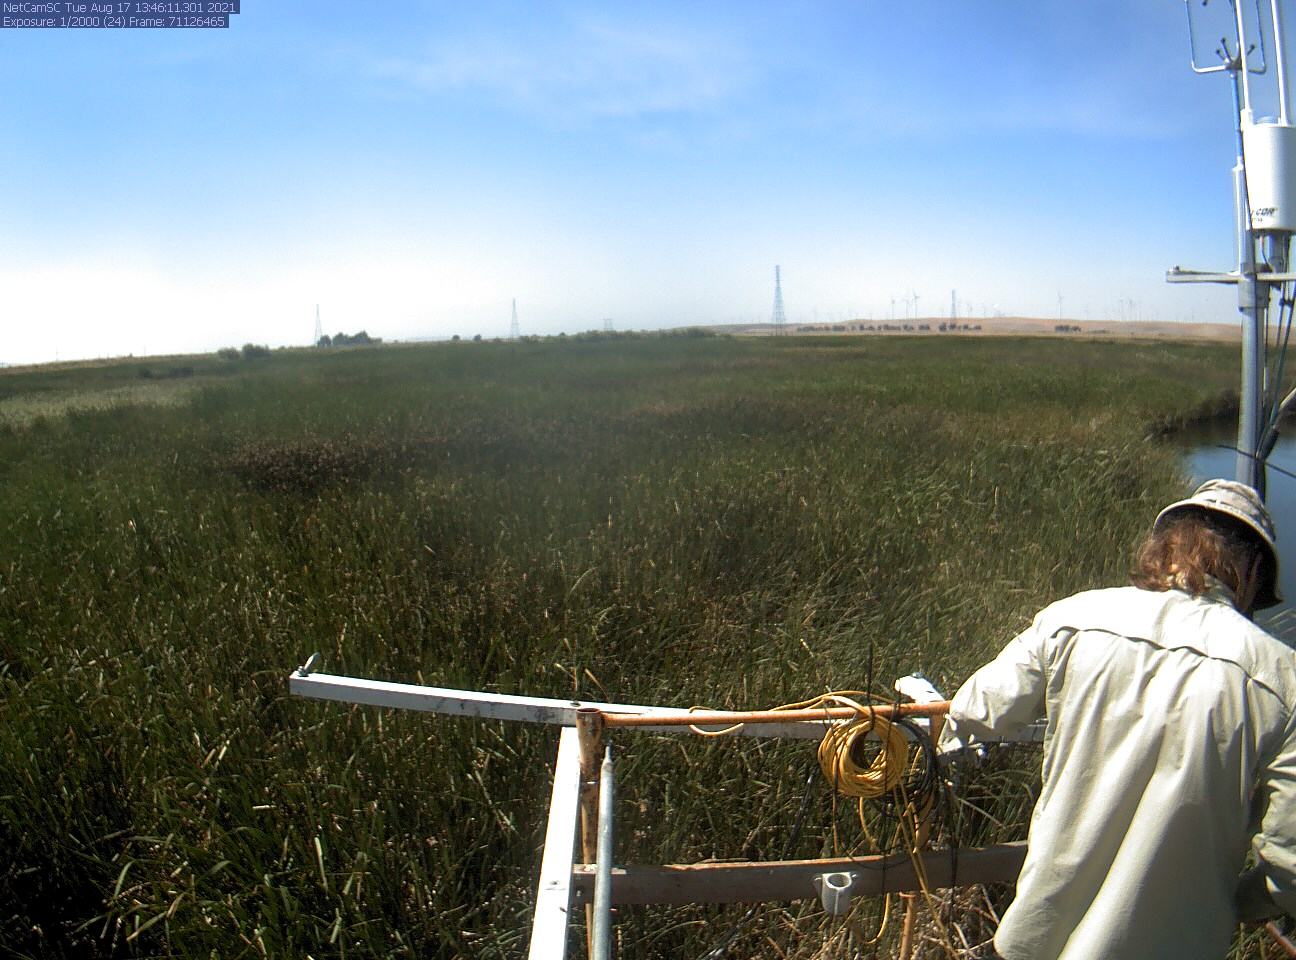
MB-stardot_2021_08_17_134609.jpg ( 2021-08-17 14:48:24 ) Full size: 1296x960
Joe on site
11 sets found
7 MB_flux graphs found
No data found for MB_met.
28 MB_tule graphs found
Can't check MBWPEESWGT_mixed
1 MB_cam graphs found
Can't check MBEEWPSWEPGT_cam
Can't check SIMBTWEE_met
1 MB_minidot graphs found
Can't check MBSWEEWPBCBA
1 MB_processed graphs found
Can't check MB_fd
1 MB_fd graphs found