
Field Notes
<--2020-12-09 14:20:00 | 2020-12-31 10:30:00-->Other sites visited today: Mayberry | East End | West Pond | Bouldin Alfalfa | Bouldin Corn
Phenocam link: Searching...
Sherman Wetland: 2020-12-16 08:30:00 (DOY 351)
Author: Daphne Szutu
Others:
Summary: Regular data collection/cleaning, installed conductvitiy sensor, 2 raccoons!
2020-12-16 I arrived at 8:30 PST. It was a chilly, mostly overcast, and calm day. There was frost on the pastures driving in, and it smelled like fresh animal dung on the boardwalk. The water level was 96cm. Soon after I arrived, I saw 2 raccoons climb up onto the boardwalk. One went pee right in front of me in what we had assumed was an otter latrine, but maybe now we think is a multi-species latrine. They inspected the battery and charge controller boxes before scampering away down the boardwalk. I’m not sure why they didn’t see or smell me right there. I downloaded met, camera, and USB GHG data. I re-used the same camera card since we might be having problems with the other card and the next site visit will be in 3 weeks after winter break. I cleaned the flux and rad sensors. The radiometers had a lot of condensation on their sensors. The wash reservoir was ¼ empty; I refilled it. I installed conductivity sensor sn 5688 with a Campbell A547. The cable was long enough for me to hang the sensor off the boardwalk, near the conductivity and eosGP sensors. Since the temperature sensor on this conductivity sensor doesn’t work, I edited the datalogger program to use TC5 for the temperature compensation, but this TC was actually a match for the MB conductivity temp, not the SW conductivity temp. I'll have to update the program again next time, but I don't think we're even saving the temperature-compensated conductivity values, so the met processor will have to find an appropriate temperature data stream to use in the Matlab code. I also updated the sensor Kc and cable length in the datalogger program and uploaded the new program to the datalogger. LI-7500 readings: I left at 9:45 PST. |
4 photos found
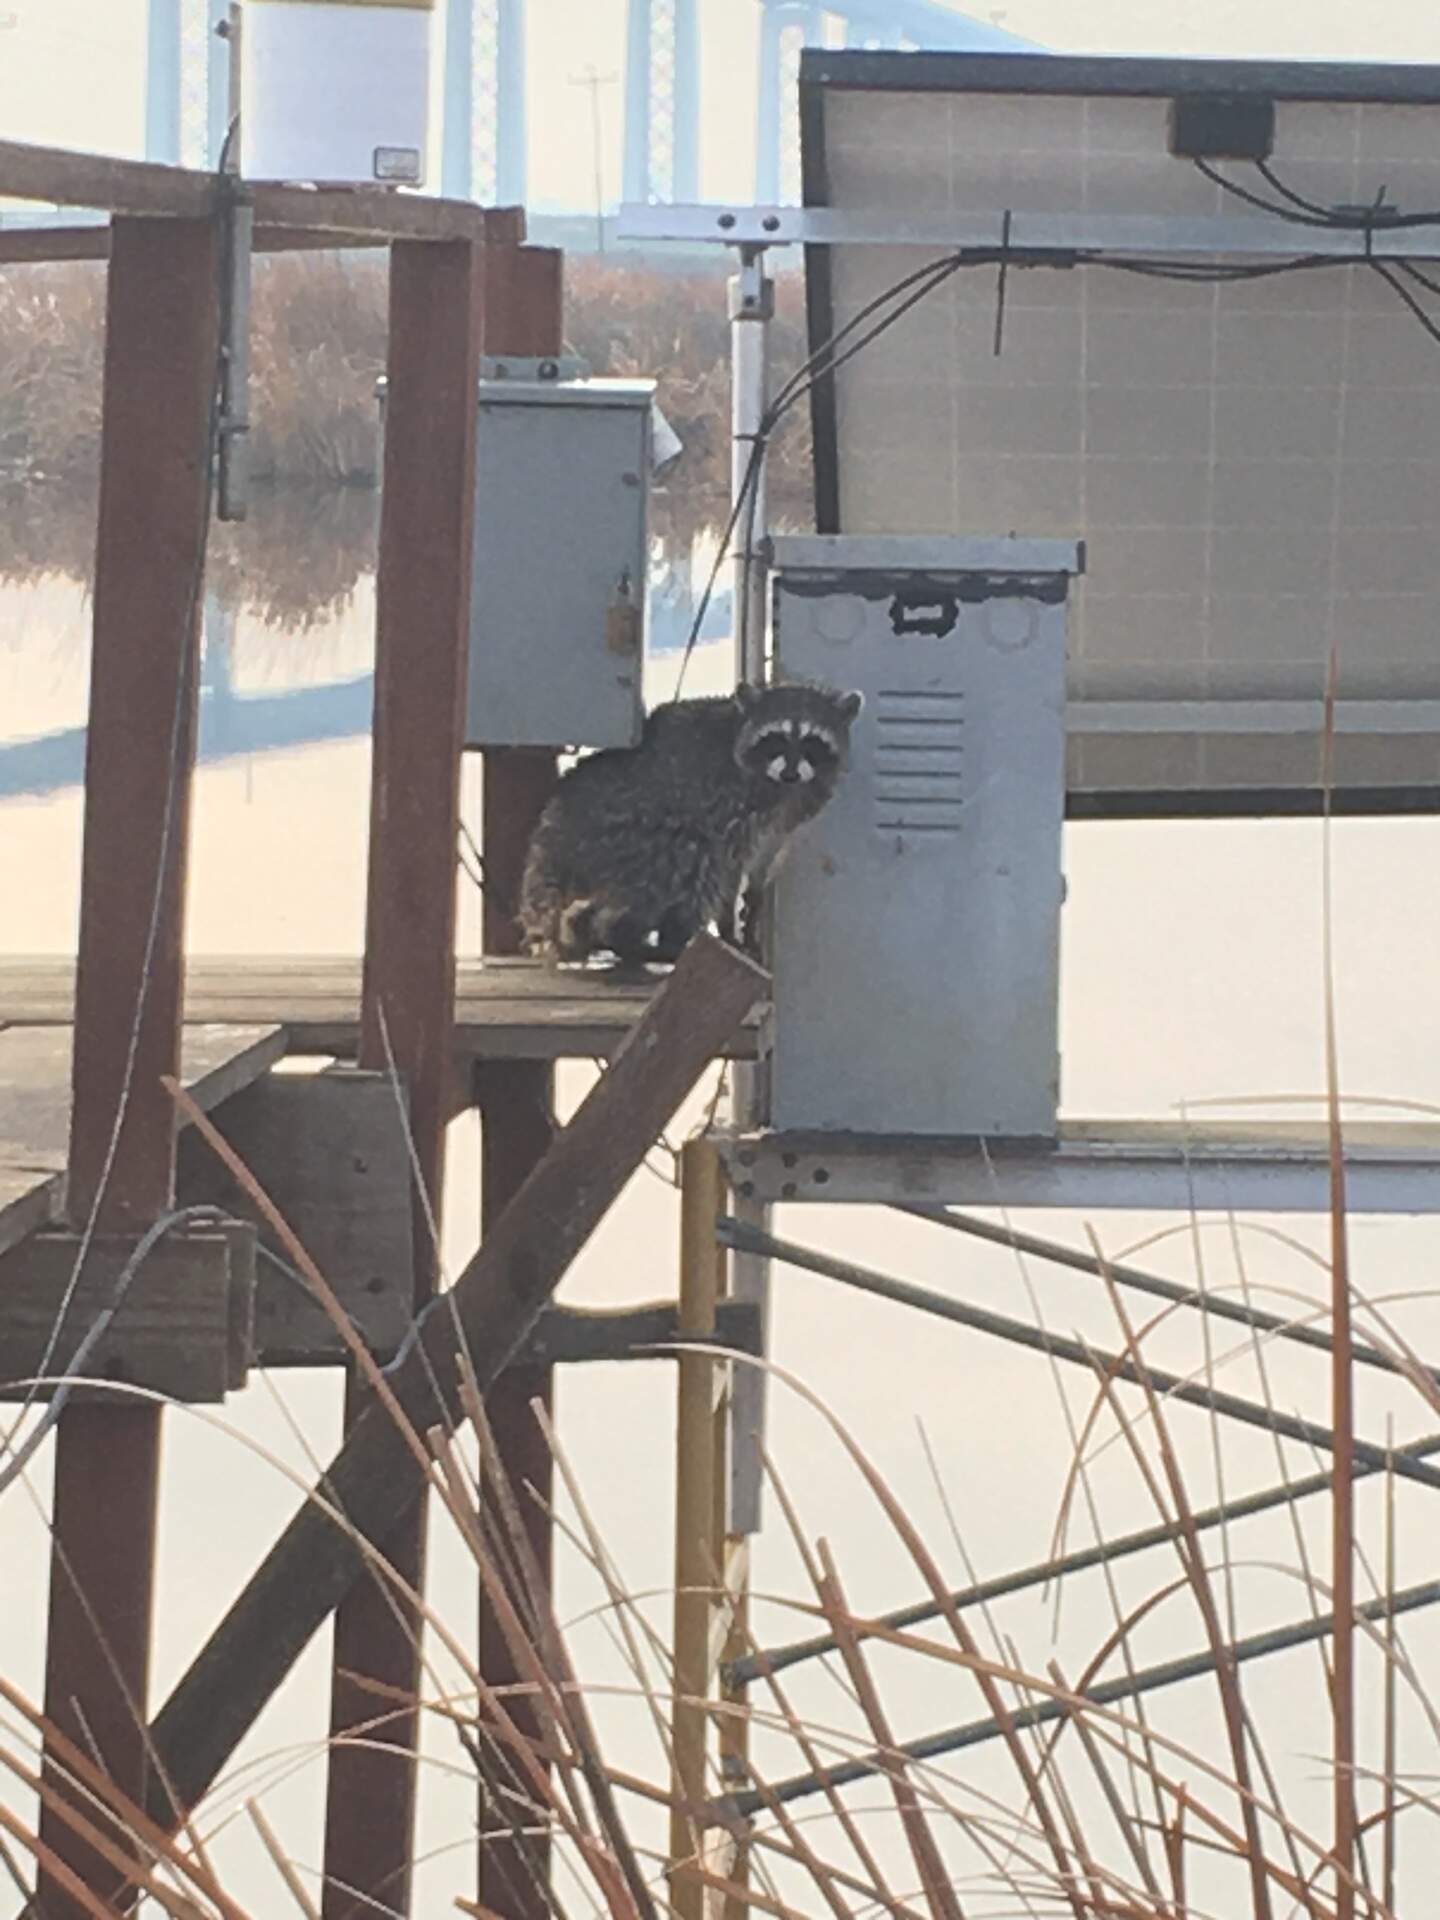
20201216SW_Racoon.jpg ( 2020-12-16 08:50:08 ) Full size: 1440x1920
1 of 2 raccoons that climbed up the boardwalk while I was servicing the site
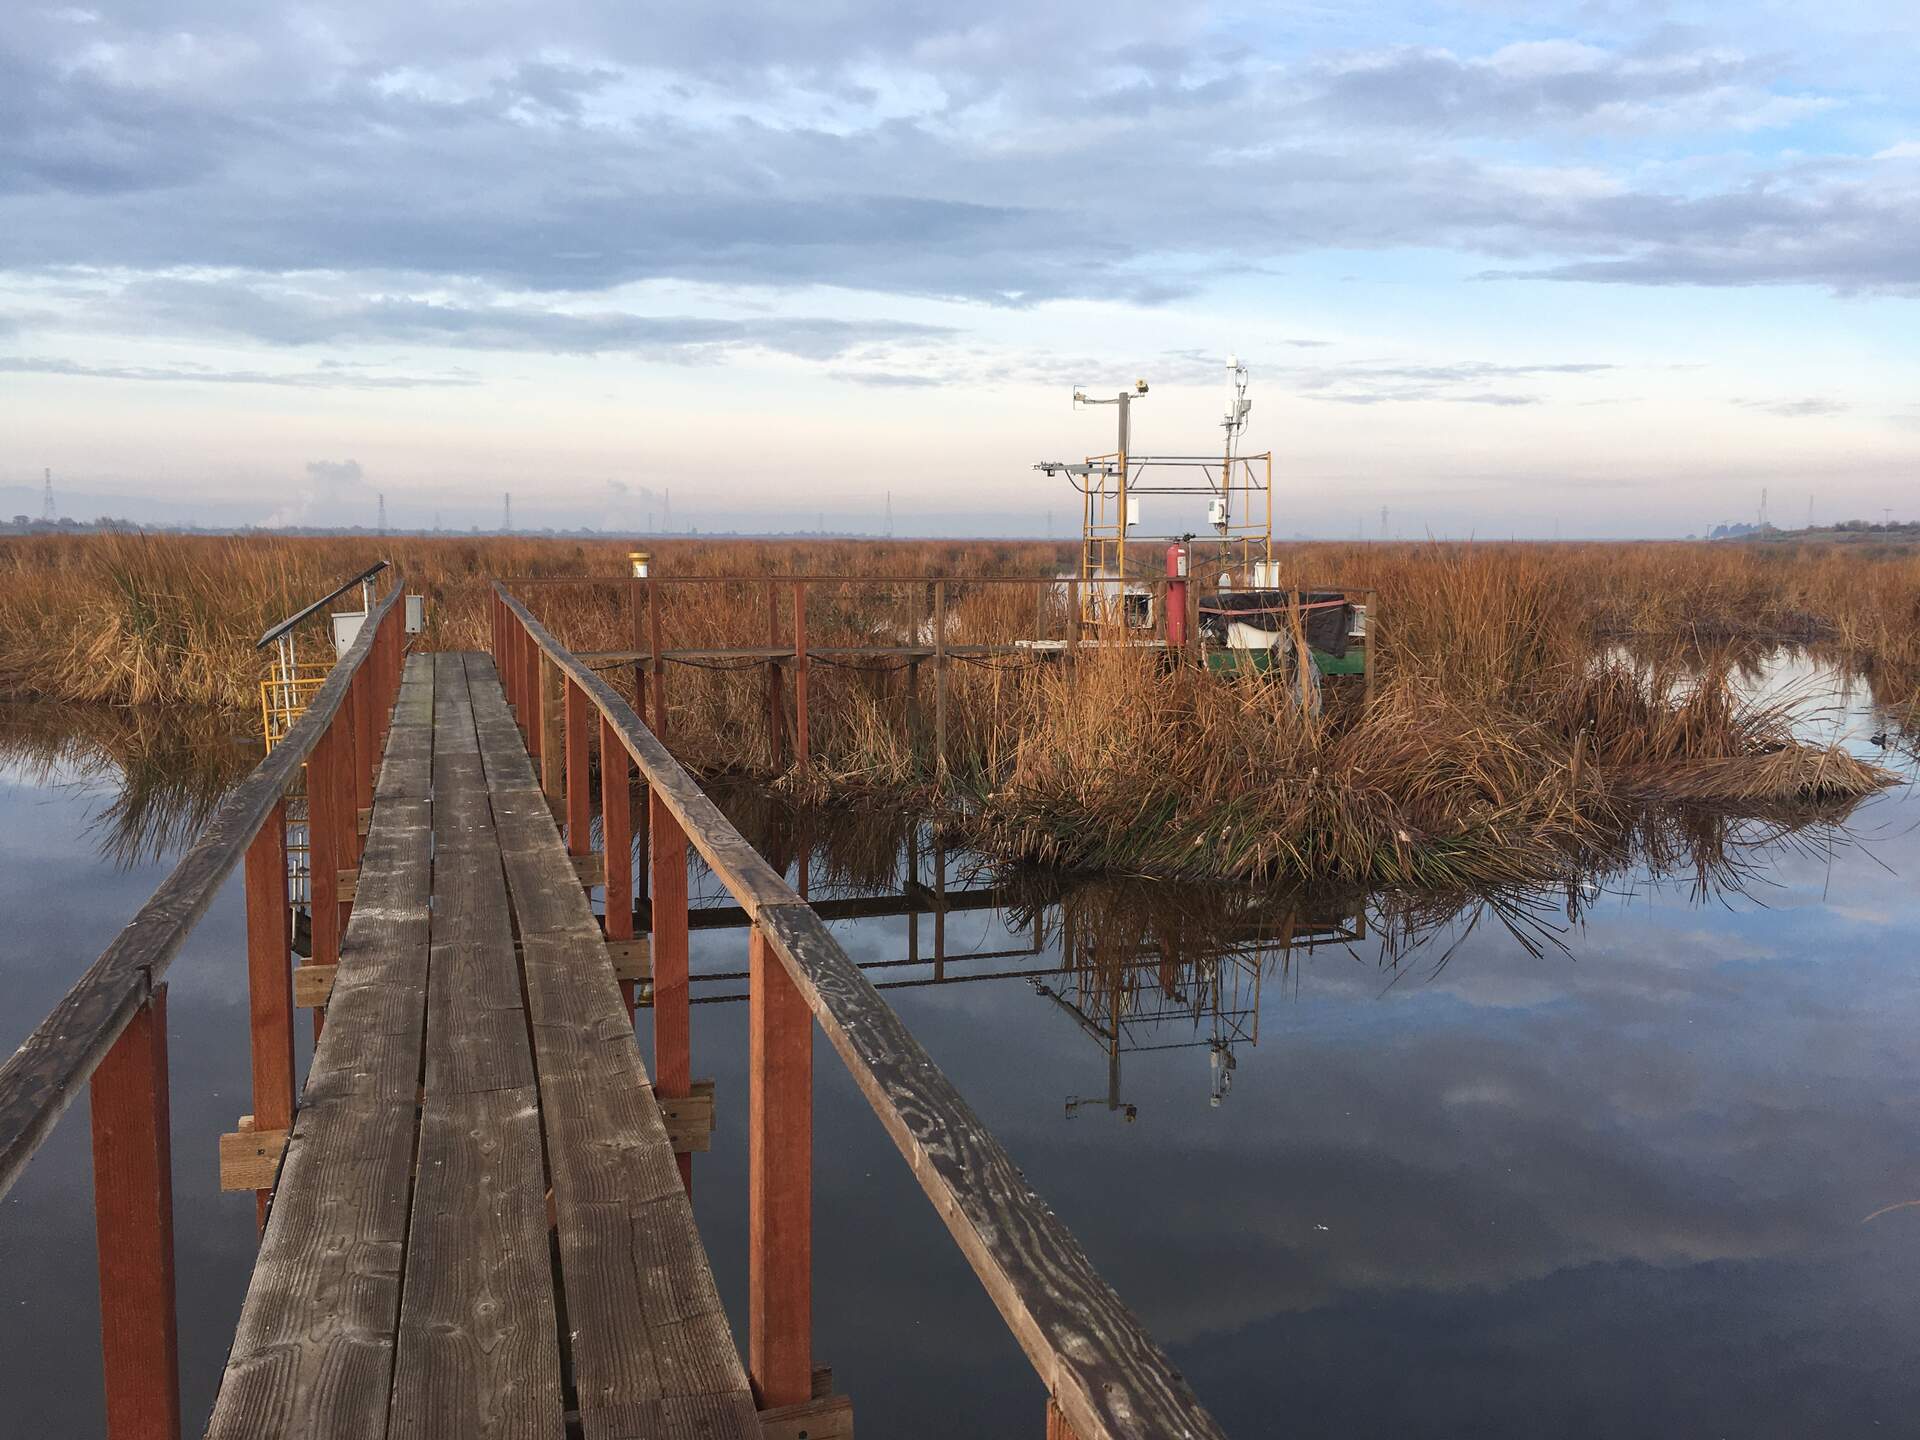
20201216SW_TowerBoardwalk.jpg ( 2020-12-16 08:40:08 ) Full size: 1920x1440
Calm winter day

20201216SW_WaterReflection.jpg ( 2020-12-16 08:40:13 ) Full size: 1920x1440
Calm winter day with hazy horizons

siwetland_2020_12_15_161405.jpg ( 2020-12-15 16:17:14 ) Full size: 1296x960
Nice sunset
7 sets found
Can't check MBWPEESWGT_mixed
Can't check MBEEWPSWEPGT_cam
16 SW_met graphs found
4 SW_flux graphs found
Can't check MBSWEEWPBCBA
Can't check SW_Temp
14 SW_Temp graphs found
3 SW_arable graphs found