Field Notes
<--2020-04-24 10:25:00 | 2020-05-21 10:45:00-->Phenocam link: Searching...
Mayberry: 2020-04-25 09:00:00 (DOY 116)
Author: Ariane Arias-Ortiz
Others: Roc
Summary: Regular surface and porewater sampling. Collected the miniDOT buried in the mud
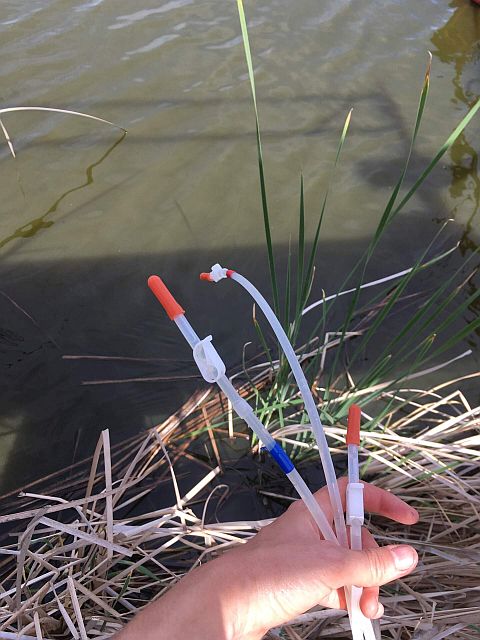
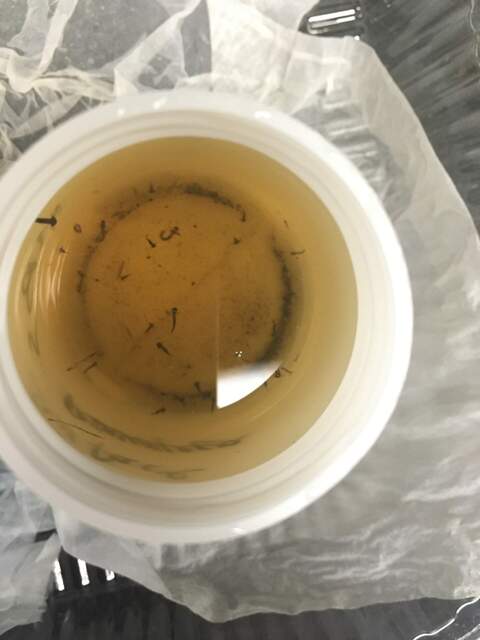
| Roc and I arrived at Mayberry at 9:00 am. It was a sunny day, light breeze and no clouds. The visit was done to collect water samples and porewaters using the sedpoints installed a week ago. The water level was high at 54 cm. The inlets were closed but some water was running into the wetland from a side pipe. For the first time since I started collecting water samples at Mayberry there was some water flowing downstream through the outlets. There was standing water in all vegetated areas across the footprint. Some sort of larvae (mosquito?) was present in the surface water samples we collected inside the wetland at the 0.5 and 0.7 footprint sites. Surface water samples were also collected from the channels, inlet and outlet locations. Surface water conductivity and salinity were lower than during previous field visits at inlets and channels (0.5 - 2.6 ppt), but was higher at the outlet loctaion (5.5 ppt). Porewaters were sampled using a peristaltic pump connected to a 12V 9Ah small battery. Sediments below 20 cm are very fine and compacted and in most locations none or small volumes of porewater could be pulled out below this depth. I need to go back and clean the clogged sedpoints before sampling again next month. It was harder than usual to sample porewaters as there were very few dry spots to place sample vials and tools. Porewater conductivity and salinity were similar than during other field visits and increased with depth (6 - 9 mS, and 3 - 5 ppt), opposite than pH. Readings at the tower were: Surface waters Conductivity: 4.7 mS Salinity: 2.61 pH: 8.39 Temp: 23 C We pulled out the miniDOT sensor I buried in the mud at 30 cm during last week of February. We left at 4 pm. |
2 photos found

20200425MB_SedPoints.jpg ( 2020-04-25 13:57:04 ) Full size: 1440x1920
Sedpoints installed at the Tower color coded according to the depth

20200425MB_Larvae.jpg ( 2020-04-25 20:21:25 ) Full size: 1440x1920
Larvae found in standing water of vegetated areas
11 sets found
7 MB_flux graphs found
No data found for MB_met.
27 MB_tule graphs found
Can't check MBWPEESWGT_mixed
1 MB_cam graphs found
Can't check MBEEWPSWEPGT_cam
Can't check SIMBTWEE_met
1 MB_minidot graphs found
Can't check MBSWEEWPBCBA
1 MB_processed graphs found
Can't check MB_fd
1 MB_fd graphs found

