Field Notes
<--2020-04-17 09:00:00 | 2020-04-25 09:00:00-->Other sites visited today: Sherman Barn | Sherman Wetland
Phenocam link: Searching...
Mayberry: 2020-04-24 10:25:00 (DOY 115)
Author: Daphne Szutu
Others:
Summary: Regular data collection/cleaning, Isabel water samples, swapped miniDOT batteries, wiped off miniDOT sensor, precip bucket clogged--cleaned
| 2020-04-24 Mayberry I arrived at 10:25 PDT. It was sunny and mild, with blue skies and a refreshing breeze. The vegetation patches are greening up around the edges, and the water level is higher than my previous site visit. The water level was 53 cm. I saw 3 otters swimming and diving away from the tower as I arrived. I cleaned flux and rad sensors. There was a thin spiderweb covering the top 7700 mirror, which is probably why the wash reservoir was empty. I cleaned inside of the 7700 cap and evicted a spider. The precipitation bucket funnel was clogged with bird poop; I poked it out with some dry reeds. The wash reservoir was empty; I mostly refilled it. I collected 3 water samples for Isabel at 9:45 PST. This is the last set of vials from Isabel. Ari will help us get more of the appropriate vials. I downloaded met, cam, miniDOT, and USB GHG data. I swapped the miniDOT and water level sensor desiccants. Since Ari had noticed the miniDOT quality flag varying more in the last few weeks, I took off the miniDOT copper screen and wiped off the sensor. There was some litter and some worms underneath the screen, but nothing outrageous. I replaced the screen and swapped the miniDOT battery. I added a few precautionary mothballs to the datalogger box. I measured the locations of the eddy sensors for Joe. I'm using the scaffolding corner post as (0,0), the long side of the scaffolding as x and the short side as y. Sonic: -13cm, 5cm 7700: 10cm, -10cm 7500: 25cm, 21cm HMP: 39cm, 19cm LI-7500 readings: CO2 416ppm H2O 433ppm T 26.1C P 101.8kPa SS 109--> 112 after cleaning --> reset to 100 in 7550 software LI7700 readings: CH4 2.1ppm --> 1.95 after cleaning RSSI 1-->87 after cleaning I left at 11:30 PDT. |
2 photos found

20200425MB_SedPoints.jpg ( 2020-04-25 13:57:04 ) Full size: 1440x1920
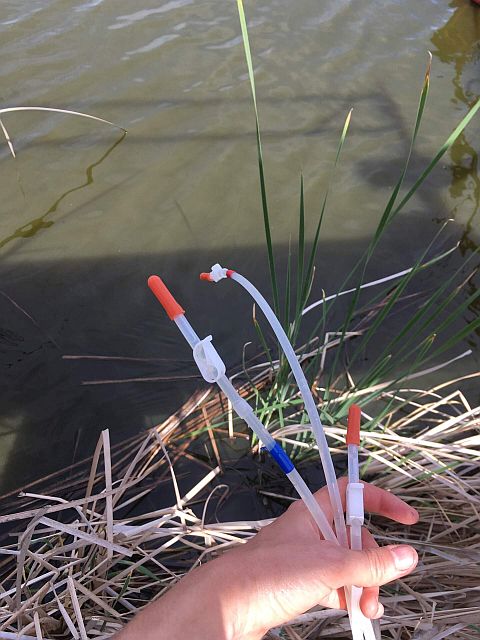
Sedpoints installed at the Tower color coded according to the depth

20200425MB_Larvae.jpg ( 2020-04-25 20:21:25 ) Full size: 1440x1920
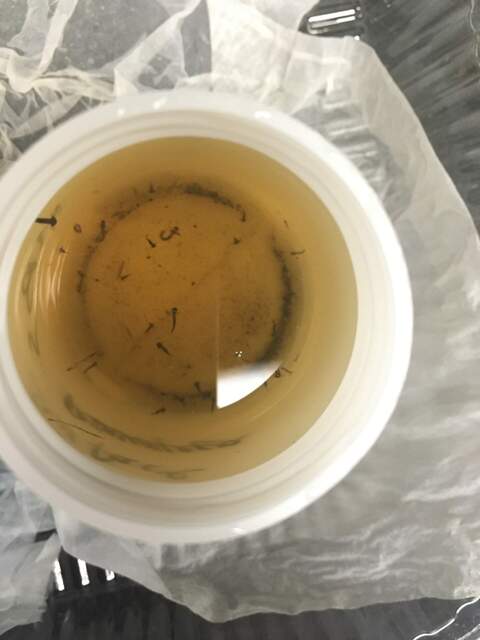
Larvae found in standing water of vegetated areas
11 sets found
7 MB_flux graphs found
No data found for MB_met.
28 MB_tule graphs found
Can't check MBWPEESWGT_mixed
1 MB_cam graphs found
Can't check MBEEWPSWEPGT_cam
Can't check SIMBTWEE_met
1 MB_minidot graphs found
Can't check MBSWEEWPBCBA
1 MB_processed graphs found
Can't check MB_fd
1 MB_fd graphs found

