Field Notes
<--2020-02-27 09:45:00 | 2020-04-03 10:30:00-->Other sites visited today: East End | Mayberry | Bouldin Alfalfa | Sherman Barn | Sherman Wetland | West Pond
Phenocam link: Searching...
Bouldin Corn: 2020-03-05 09:15:00 (DOY 65)
Author: Daphne Szutu
Others: Ariane
Summary: Regular data collection/cleaning, windy
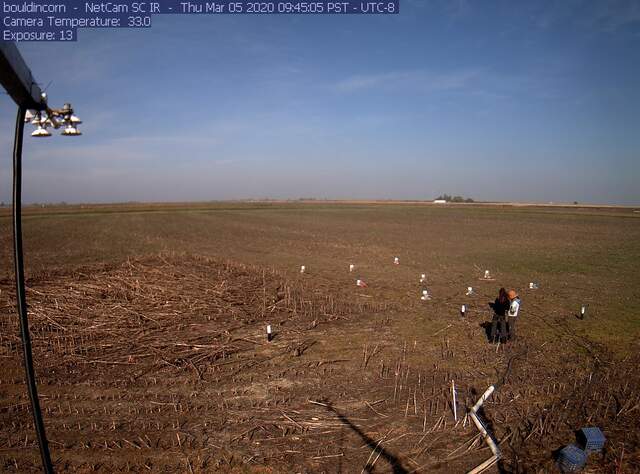
| 2020-03-05 Bouldin Corn Ariane and I arrived at 9:15 PST. It was a sunny, windy day with a cold wind and cirrus clouds. The field is dry and the soil is only a little soft. There was dew on the grass on the field. I downloaded met, camera, USB GHG, PA, and FD data. I did not power on/off the PA sensor. Ariane cleaned flux and rad sensors. The wash reservoir was full, but I forgot to test the spray and wash again. I tried to download the FD data on the new field laptop, but eosLink told me it downloaded “with errors,†and the format was all jumbled in the .csv. I ended up downloading the FD data to the old laptop. The laptop screen died when it was almost done downloading the 3rd chamber, so I’ll try again next time. I did not clear any of the chamber data. We left at 10:25 PST. |
1 photos found

bouldincorn_2020_03_05_094505.jpg ( 2020-03-05 08:44:28 ) Full size: 1296x960
Ariane and Daphne downloading FD chambers
6 sets found
17 BC_met graphs found
5 BC_flux graphs found
Can't check TATWBABCSB_cam
Can't check MBSWEEWPBCBA
2 BC_pa graphs found
1 BC_arable graphs found

