
Field Notes
<--2020-02-20 13:50:00 | 2020-03-11 15:25:00-->Other sites visited today: East End | Mayberry | Bouldin Alfalfa | Bouldin Corn | Sherman Barn | West Pond
Phenocam link: Searching...
Sherman Wetland: 2020-03-05 13:50:00 (DOY 65)
Author: Daphne Szutu
Others: Ariane
Summary: Permanent tower: Regular data collection/cleaning, windy, some new cattails coming up Temp tower: Regular data collection/cleaning, swapped 7500 for calibration, new CR1000 program, windy, some new cattails coming up
| 2020-03-05 Sherman Wetland Ariane and I arrived at 13:50 PST. It was a sunny, windy day with a cold wind and cirrus clouds. There were some new cattails coming up along the boardwalk and in front of the tower. The water level was 83 cm. I downloaded met, camera, and USB GHG data. The 7550 clock looked good. Ariane cleaned flux and rad sensors. The wash reservoir was mostly full; we topped it off. LI-7500 readings: CO2 420ppm H2O 576ppm T 17.7C P 101.8kPa SS 96--> 98 after cleaning LI7700 readings: CH4 2.01 ppm RSSI 45--> 84 after cleaning We left at 14:05 PST. 2020-03-05 Sherman Wetland Temp Tower Ariane and I arrived around 14:15 PST. It was a sunny, windy day with a cold wind and cirrus clouds. There was no water under the tower, but there were some green cattail coming up through the litter. I downloaded met, camera, and USB GHG data. Ariane cleaned flux and rad sensors. There were wasps in the wash reservoir and some dead wasps in the datalogger. I put some more mothballs in the datalogger box. I uploaded a new CR1000 program (v20200130) which removed some unnecessary columns that were leftover from the EP program. I also moved PARin and PARout to higher channels on the mux to see if that would fix their gaps. We swapped the 7500 for calibration: sn 0041 came down and sn 75H-2514 went up. I uploaded the new config file, updated the pressure coefficient, and reset the 7550 box. There was a 7700 clock sync error. I adjusted the 7550 time -2m in to sync with the laptop time and reset the 7550 box, which resolved the clock sync error. LI-7500 readings (sn 0041 --> sn 0041 after cleaning --> sn 75H-2514): CO2 413ppm --> 416 after cleaning --> 423 H2O 517ppm --> 500 after cleaning --> 512 T 19.8C --> 19.7 after cleaning --> 19.4 P 102.1kPa --> 102.0 after cleaning --> 102.0 SS 99--> 101 after cleaning --> 99 LI7700 readings: CH4 1.99ppm RSSI 48--> 85 after cleaning We left at 14:45 PST. |
1 photos found
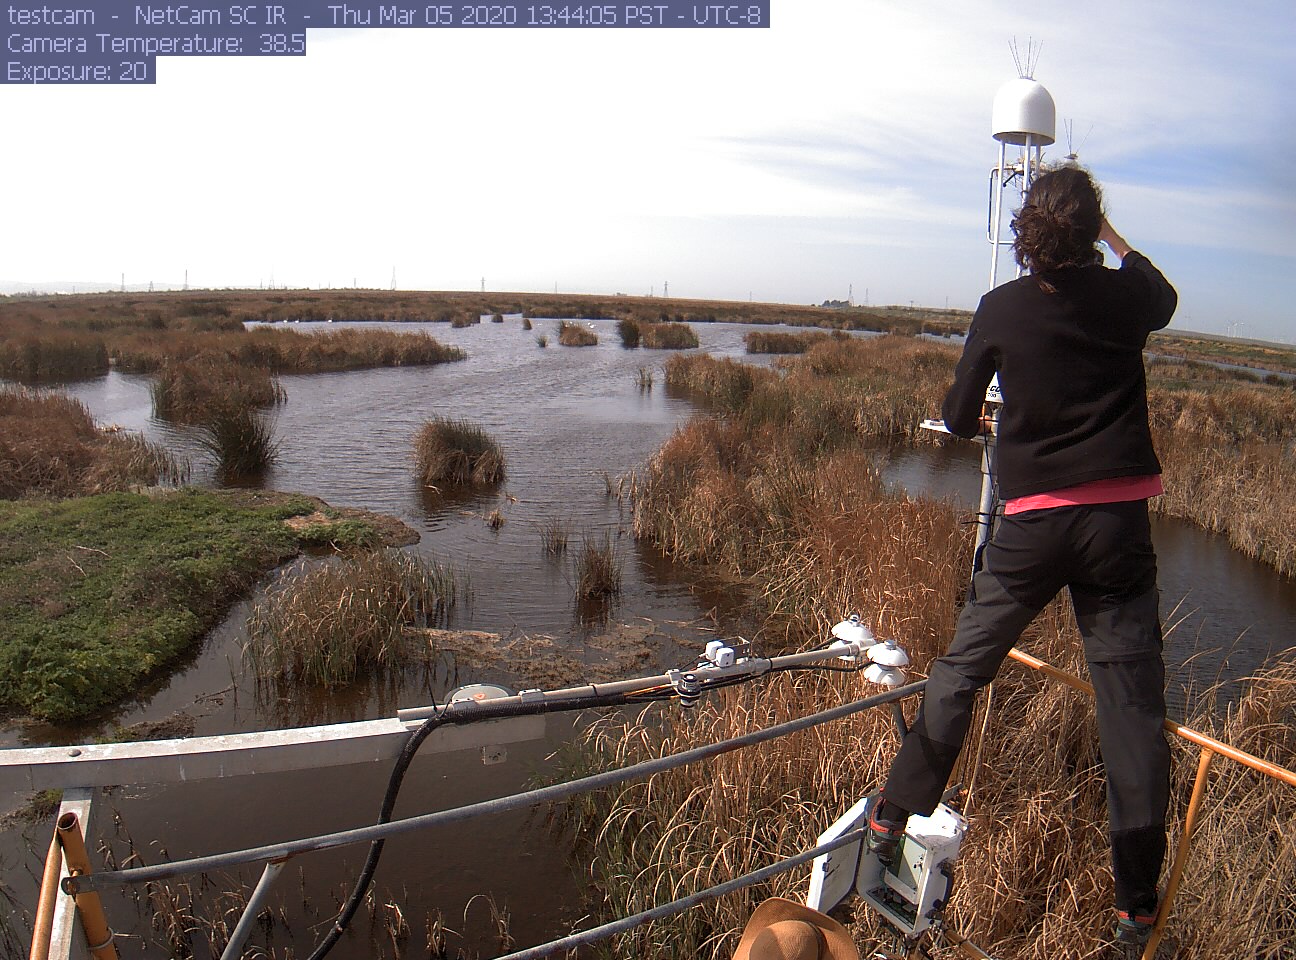
siwetland_2020_03_05_134405.jpg ( 2020-03-05 12:59:02 ) Full size: 1296x960
Ariane cleaning
7 sets found
Can't check MBWPEESWGT_mixed
Can't check MBEEWPSWEPGT_cam
16 SW_met graphs found
4 SW_flux graphs found
Can't check MBSWEEWPBCBA
Can't check SW_Temp
14 SW_Temp graphs found
3 SW_arable graphs found