
Field Notes
<--2020-02-20 12:25:00 | 2020-03-11 10:15:00-->Other sites visited today: Mayberry | Bouldin Alfalfa | Bouldin Corn | Sherman Barn | Sherman Wetland | West Pond
Phenocam link: Searching...
East End: 2020-03-05 12:05:00 (DOY 65)
Author: Daphne Szutu
Others: Ariane
Summary: Regular data collection/cleaning, adjusted 7550 clock +10 min, 7700 not connected--fixed, smoky horizons
| 2020-03-05 East End Ariane and I arrived at 12:05 PST. It was a sunny, mild day with a breeze and hazy horizons. We smelled smoke. The water level was 20 cm, a little lower than before. There was a small wasp nest on the scaffolding post by the radiation boom. Ariane cleaned flux and rad sensors. I downloaded met, camera, and USB GHG data. We dropped the resistor we use to turn the camera on/off. The wash reservoir was 30% full; we refilled it. There were wasps in the reservoir box. I adjusted the 7550 clock 10 minutes (12:36-->12:26) to sync with the laptop time. I reset the 7550 box and had to re-connect the 7700 in the 7550 interface. The NDVI values have been funky, but the sensors looked fine. We lowered the miniDOT a little because it was almost out of the water, and we raised the eosCO2 a smidge because its face was laying against the mud. LI-7500 readings: CO2 426ppm H2O 536ppm T 19.8C P 101.9kPa SS 95 --> 96 after cleaning LI7700 readings: CH4 2.04ppm RSSI 45--> 82 after cleaning We left at 12:35 PST. As we were leaving Twitchell Island to go to Sherman Island, we saw haze/smoke on the horizons to the north. Back in the lab, I realized we are missing methane data for the last 2 weeks. The 7700 was not connected since the last site visit when we swapped a 7500. |
1 photos found
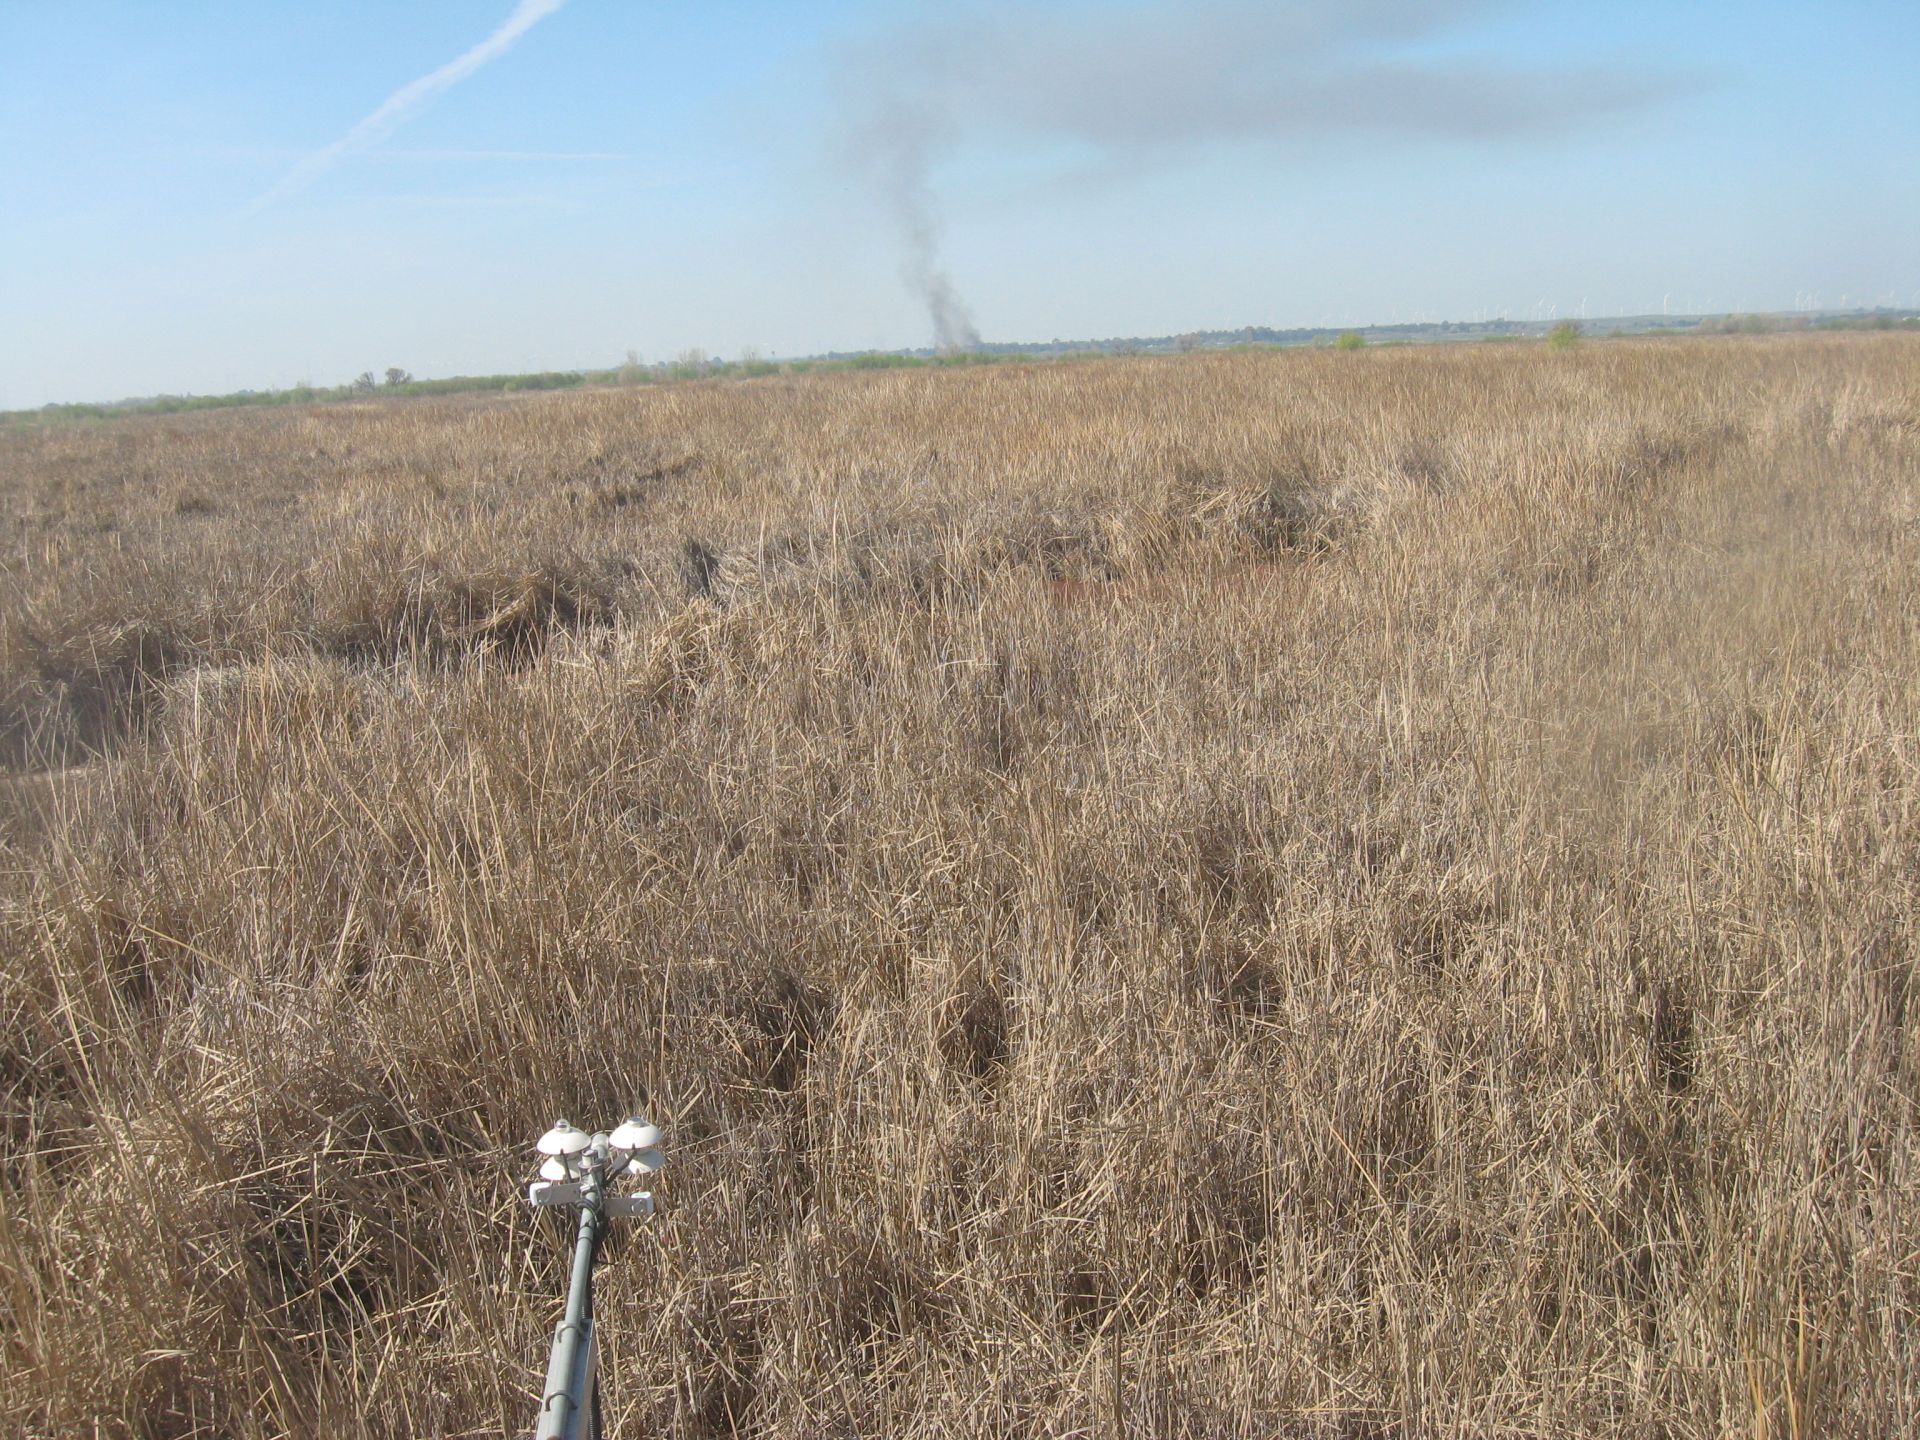
EE_autocam_20200304_1200.jpg ( 2020-03-04 12:00:01 ) Full size: 1920x1440
Smoke on the horizon
11 sets found
14 EE_met graphs found
Can't check EE_mixed
1 EE_mixed graphs found
8 EE_flux graphs found
Can't check MBWPEESWGT_mixed
1 EE_cam graphs found
Can't check MBEEWPSWEPGT_cam
Can't check SIMBTWEE_met
Can't check EE_Temp
5 EE_Temp graphs found
Can't check EE_minidot
1 EE_minidot graphs found
Can't check MBSWEEWPBCBA
1 EE_processed graphs found