Field Notes

<--2018-09-05 14:30:00 | 2018-09-18 14:40:00-->
Other sites visited today: Bouldin Alfalfa | West Pond | East Pond | East End | Sherman Barn | Sherman Wetland | Mayberry | Bouldin Corn

Sherman Wetland: 2018-09-18 12:15:00 (DOY 261)
Author: Patty Oikawa
Others:

Summary: Changed filters on profile, downloaded LGR data

I arrived at 12:15pm. The Cal gas is now at 800psi.
The LGR happened to be measuring 3m inlet when I arrived with these recorded values:
co2=413.41ppm
D13C=-15.43
D18O=-89.03
H2O=251ppm
Gas t=44.81
Gas P=119.77Torr
Laser response=12.85us

Checked on filters: Changed filter on 1m and top of tower.
Downloaded data. Tried to delete old files on LGR but it was taking a long time, better to do remotely.
Need to find a way to deter otters, way too much poop!

1 photos found

Starlings on tower
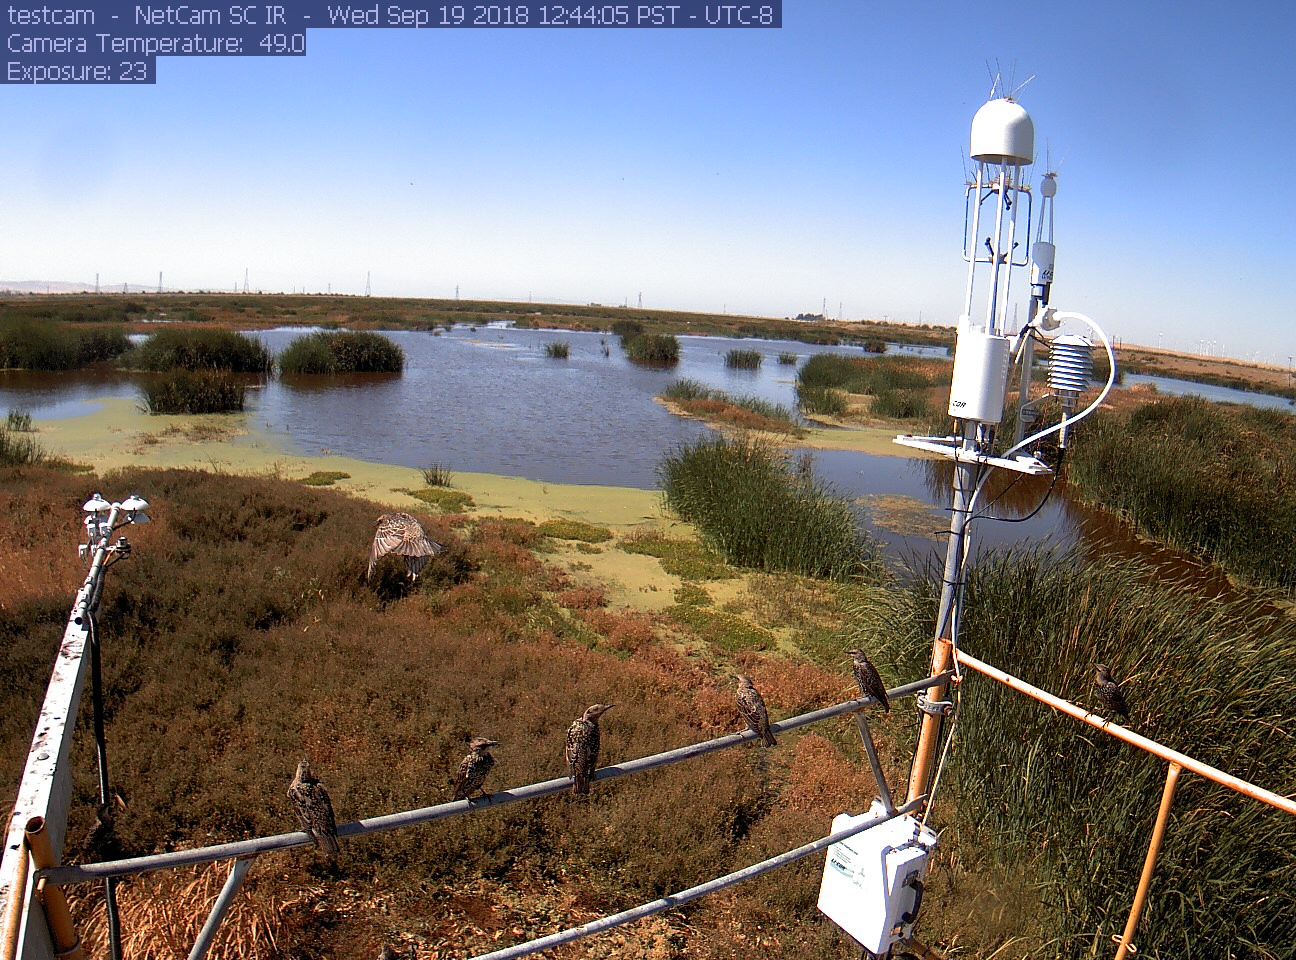
siwetland_2018_09_19_124405.jpg ( 2018-09-19 12:49:18 ) Full size: 1296x960
Starlings on tower

Graphs display:
7 sets found

Can't check MBWPEESWGT_mixed
Can't check MBEEWPSWEPGT_cam
16 SW_met graphs found

Explore the graph:Temperatures in a new window

Explore the graph:Water Temperature Profile A in a new window

Explore the graph:Water Temperature Profile B in a new window

Explore the graph:Soil Temperature Profile C2 in a new window

Explore the graph:Soil Heat Flux in a new window

Explore the graph:Four channel Radiometer in a new window

Explore the graph:Sherman Wetland PAR in a new window

Explore the graph:PRI Channels in a new window

Explore the graph:NDVI Channels in a new window

Explore the graph:Water level and Rain in a new window

Explore the graph:Dissolved CO2 in a new window

Explore the graph:Air Pressure in a new window

Explore the graph:Battery Voltage and RH in a new window

Explore the graph:Soil Temperature Profile C1 in a new window

Explore the graph:SRS NDVI and PRI in a new window

Explore the graph:SW miniDOT Dissolved Oxygen in a new window

4 SW_flux graphs found

Explore the graph:CO2 and H2O in a new window

Explore the graph:Wind in a new window

Explore the graph:Methane in a new window

Explore the graph:Data Counts in a new window

Can't check MBSWEEWPBCBA
Can't check SW_Temp
14 SW_Temp graphs found

Explore the graph:Temperatures in a new window

Explore the graph:CO2 and H2O in a new window

Explore the graph:Wind in a new window

Explore the graph:Methane in a new window

Explore the graph:Data Counts in a new window

Explore the graph:Temperature Profile A in a new window

Explore the graph:Temperature Profile B in a new window

Explore the graph:Temperature Profile C in a new window

Explore the graph:Soil Heat Flux in a new window

Explore the graph:Four-channel radiometer in a new window

Explore the graph:NDVI Channels in a new window

Explore the graph:PAR in a new window

Explore the graph:Air Pressure and Water Level in a new window

Explore the graph:Air T and RH in a new window

No data found for SW_arable.