Field Notes

<--2018-09-18 12:15:00 | 2018-10-04 14:10:00-->
Other sites visited today: Bouldin Alfalfa | West Pond | East Pond | East End | Sherman Barn | Mayberry | Sherman Wetland | Bouldin Corn

Sherman Wetland: 2018-09-18 14:40:00 (DOY 261)
Author: Joe Verfaillie
Others: Daphne

Summary: Standard data collection, water level a little higher, cleaned solar panels.

Sherman Wetland
2018-09-18

I arrived at 14:40 with Daphne. It was clear sunny and warm with a nice breeze. The water level was 62cm, a little higher, standing water under the tower. Some cattails on higher ground near the level have died but otherwise the site is still green. There are new tules sprouting from the bunches that Kyle transplanted near the boardwalk. Lots of blackberry enhanced poop everywhere.

The 7500 read: 398ppm CO2, 540mmol/m3 H2O, 23.4C, 101.2kPa, 105SS – 107 after cleaning
The 7700 read: 1.99ppm CH4, 65RSSI – 79 after cleaning
The wash reservoir was full.

I cleaned the solar panels.

We left at 14:55

1 photos found

Starlings on tower
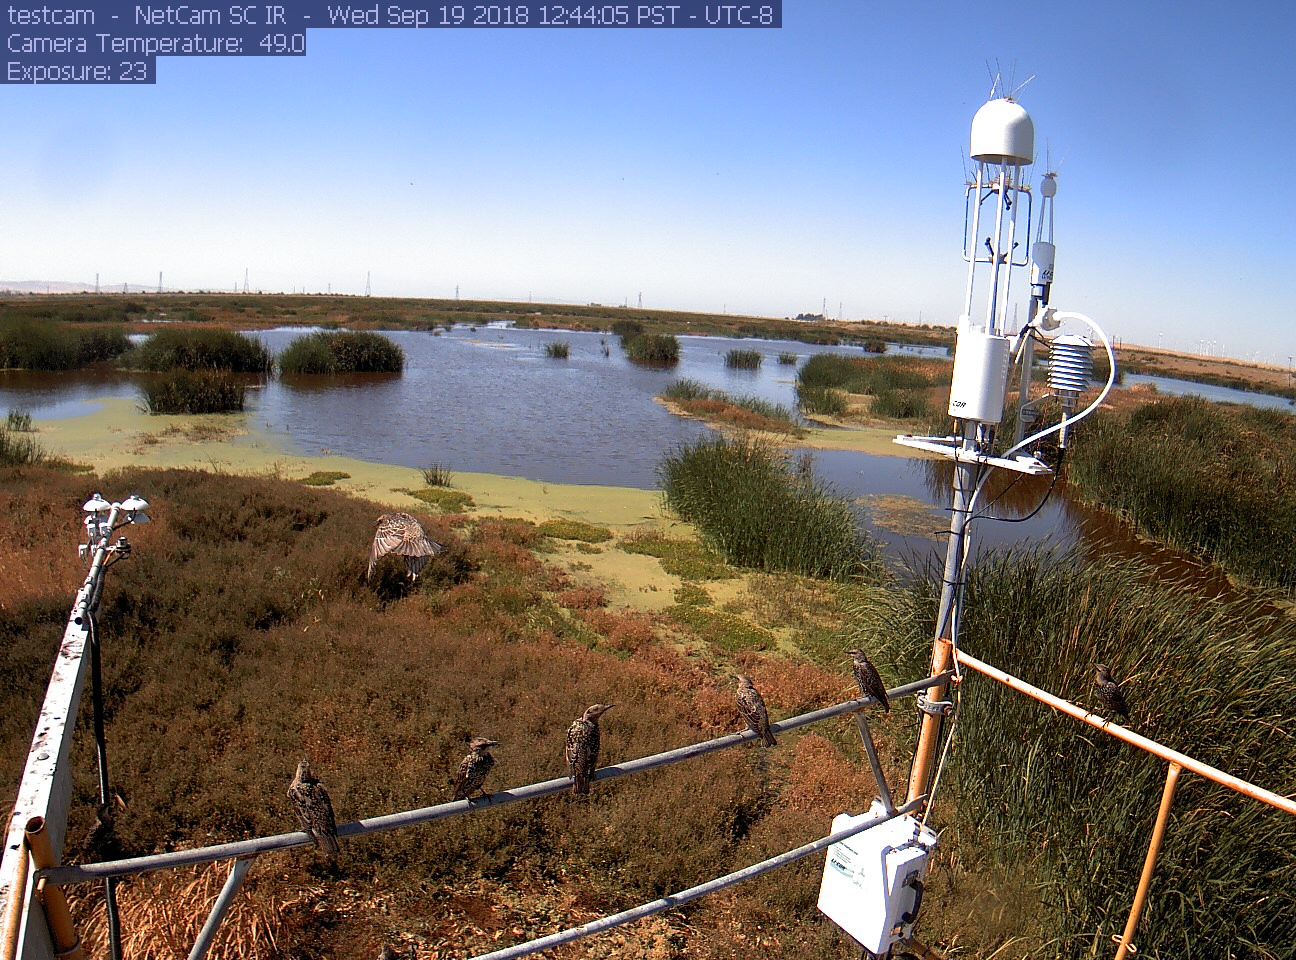
siwetland_2018_09_19_124405.jpg ( 2018-09-19 12:49:18 ) Full size: 1296x960
Starlings on tower

Graphs display:
7 sets found

Can't check MBWPEESWGT_mixed
Can't check MBEEWPSWEPGT_cam
16 SW_met graphs found

Explore the graph:Temperatures in a new window

Explore the graph:Water Temperature Profile A in a new window

Explore the graph:Water Temperature Profile B in a new window

Explore the graph:Soil Temperature Profile C2 in a new window

Explore the graph:Soil Heat Flux in a new window

Explore the graph:Four channel Radiometer in a new window

Explore the graph:Sherman Wetland PAR in a new window

Explore the graph:PRI Channels in a new window

Explore the graph:NDVI Channels in a new window

Explore the graph:Water level and Rain in a new window

Explore the graph:Dissolved CO2 in a new window

Explore the graph:Air Pressure in a new window

Explore the graph:Battery Voltage and RH in a new window

Explore the graph:Soil Temperature Profile C1 in a new window

Explore the graph:SRS NDVI and PRI in a new window

Explore the graph:SW miniDOT Dissolved Oxygen in a new window

4 SW_flux graphs found

Explore the graph:CO2 and H2O in a new window

Explore the graph:Wind in a new window

Explore the graph:Methane in a new window

Explore the graph:Data Counts in a new window

Can't check MBSWEEWPBCBA
Can't check SW_Temp
14 SW_Temp graphs found

Explore the graph:Temperatures in a new window

Explore the graph:CO2 and H2O in a new window

Explore the graph:Wind in a new window

Explore the graph:Methane in a new window

Explore the graph:Data Counts in a new window

Explore the graph:Temperature Profile A in a new window

Explore the graph:Temperature Profile B in a new window

Explore the graph:Temperature Profile C in a new window

Explore the graph:Soil Heat Flux in a new window

Explore the graph:Four-channel radiometer in a new window

Explore the graph:NDVI Channels in a new window

Explore the graph:PAR in a new window

Explore the graph:Air Pressure and Water Level in a new window

Explore the graph:Air T and RH in a new window

No data found for SW_arable.